

Question: Please answer all!! the first image is Study Result file and the second image is Mouse Metadata Please use pandas and Matplotlib, thanks! A B
Please answer all!!
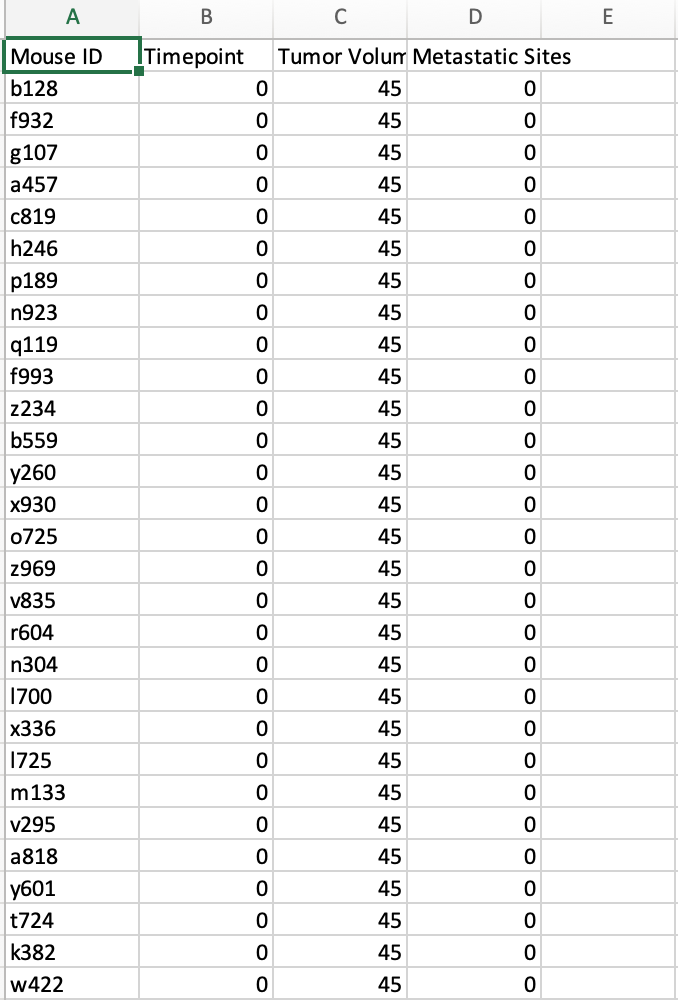
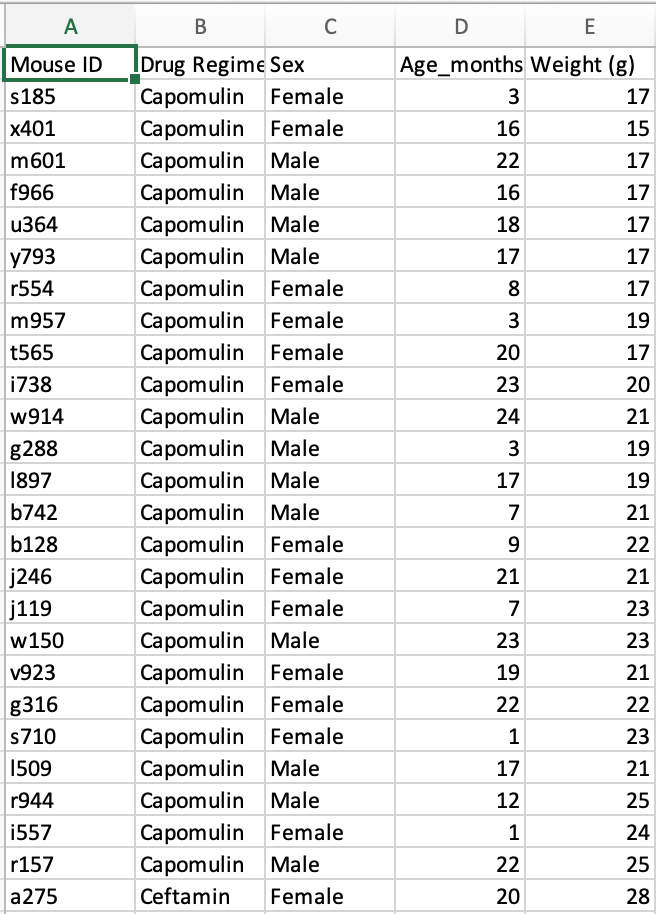
the first image is "Study Result" file and the second image is "Mouse Metadata"
Please use pandas and Matplotlib, thanks!
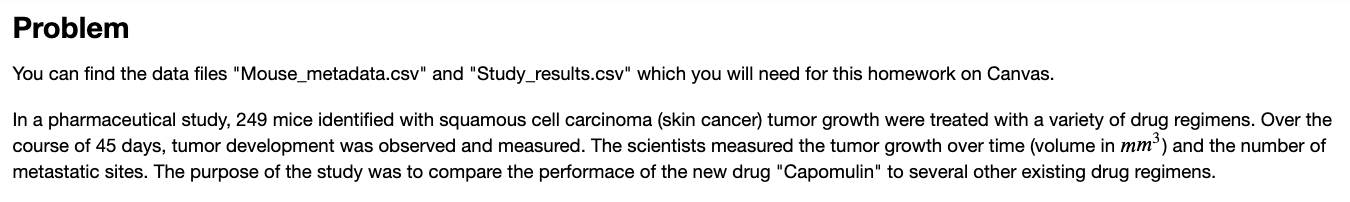
A B C D E Timepoint Tumor Volunr Metastatic Sites 45 0 45 0 45 0 45 0 45 0 45 0 0 45 0 0 45 0 0 45 0 0 45 0 0 45 0 0 45 0 O O O O O O 0 45 0 0 45 0 Mouse ID b128 f932 g107 a457 0819 h246 p189 n923 q119 f993 z234 b559 y260 x930 0725 z969 V835 r604 n304 1700 x336 1725 m133 V295 a818 y601 t724 k382 w422 0 45 0 0 45 0 0 45 0 0 45 0 0 45 0 0 45 0 0 45 0 0 45 0 0 0 45 45 0 0 0 45 0 0 0 0 0 45 45 45 45 0 0 0 0 A B D E Age_months Weight (g) 3 17 16 15 22 17 16 17 18 17 17 17 8 17 3 19 20 17 23 20 24 21 3 19 Mouse ID s185 x401 m601 f966 u364 y793 r554 m957 t565 i738 w914 g288 1897 b742 b128 j246 j119 w 150 v923 g316 s710 1509 r944 i557 r157 a 275 Drug Regime Sex Capomulin Female Capomulin Female Capomulin Male Capomulin Male Capomulin Male Capomulin Male Capomulin Female Capomulin Female Capomulin Female Capomulin Female Capomulin Male Capomulin Male Capomulin Male Capomulin Male Capomulin Female Capomulin Female Capomulin Female Capomulin Male Capomulin Female Capomulin Female Capomulin Female Capomulin Male Capomulin Male Capomulin Female Capomulin Male Ceftamin Female 17 19 7 9 21 21 22 21 23 23 21 7 22 23 19 22 1 17 12 1 22 20 23 21 25 24 25 28 Problem You can find the data files "Mouse_metadata.csv" and "Study_results.csv" which you will need for this homework on Canvas. In a pharmaceutical study, 249 mice identified with squamous cell carcinoma (skin cancer) tumor growth were treated with a variety of drug regimens. Over the course of 45 days, tumor development was observed and measured. The scientists measured the tumor growth over time (volume in mm%) and the number of metastatic sites. The purpose of the study was to compare the performace of the new drug "Capomulin" to several other existing drug regimens. (g) Use Matplotlib to create a scatterplot of final tumor size on day 45 against initial mouse weight for the mice who survived until day 45. Use different colors for different drug treatments. Make sure to label your plot (include x- and y-axis labels, title, and a legend for which color belongs to which drug). Please place the legend outside the plot. # YOUR CODE HERE raise Not ImplementedError() (h) Comment on what you see in the plot you just created. Do the mice seem to have been randomly assigned to the treatments? YOUR ANSWER HERE (0) Create a side-by-side boxplot for initial mouse weight across drug regimens. Order the drugs, so that the boxplots for the drugs "Capomulin" and "Ramicane" appear on the left. Note: Look at the matplotlib gallery to understand how to create a side-by-side boxplot. Hint: start with a list of lists of values you want to plot. : # YOUR CODE HERE raise NotImplementedError() A B C D E Timepoint Tumor Volunr Metastatic Sites 45 0 45 0 45 0 45 0 45 0 45 0 0 45 0 0 45 0 0 45 0 0 45 0 0 45 0 0 45 0 O O O O O O 0 45 0 0 45 0 Mouse ID b128 f932 g107 a457 0819 h246 p189 n923 q119 f993 z234 b559 y260 x930 0725 z969 V835 r604 n304 1700 x336 1725 m133 V295 a818 y601 t724 k382 w422 0 45 0 0 45 0 0 45 0 0 45 0 0 45 0 0 45 0 0 45 0 0 45 0 0 0 45 45 0 0 0 45 0 0 0 0 0 45 45 45 45 0 0 0 0 A B D E Age_months Weight (g) 3 17 16 15 22 17 16 17 18 17 17 17 8 17 3 19 20 17 23 20 24 21 3 19 Mouse ID s185 x401 m601 f966 u364 y793 r554 m957 t565 i738 w914 g288 1897 b742 b128 j246 j119 w 150 v923 g316 s710 1509 r944 i557 r157 a 275 Drug Regime Sex Capomulin Female Capomulin Female Capomulin Male Capomulin Male Capomulin Male Capomulin Male Capomulin Female Capomulin Female Capomulin Female Capomulin Female Capomulin Male Capomulin Male Capomulin Male Capomulin Male Capomulin Female Capomulin Female Capomulin Female Capomulin Male Capomulin Female Capomulin Female Capomulin Female Capomulin Male Capomulin Male Capomulin Female Capomulin Male Ceftamin Female 17 19 7 9 21 21 22 21 23 23 21 7 22 23 19 22 1 17 12 1 22 20 23 21 25 24 25 28 Problem You can find the data files "Mouse_metadata.csv" and "Study_results.csv" which you will need for this homework on Canvas. In a pharmaceutical study, 249 mice identified with squamous cell carcinoma (skin cancer) tumor growth were treated with a variety of drug regimens. Over the course of 45 days, tumor development was observed and measured. The scientists measured the tumor growth over time (volume in mm%) and the number of metastatic sites. The purpose of the study was to compare the performace of the new drug "Capomulin" to several other existing drug regimens. (g) Use Matplotlib to create a scatterplot of final tumor size on day 45 against initial mouse weight for the mice who survived until day 45. Use different colors for different drug treatments. Make sure to label your plot (include x- and y-axis labels, title, and a legend for which color belongs to which drug). Please place the legend outside the plot. # YOUR CODE HERE raise Not ImplementedError() (h) Comment on what you see in the plot you just created. Do the mice seem to have been randomly assigned to the treatments? YOUR ANSWER HERE (0) Create a side-by-side boxplot for initial mouse weight across drug regimens. Order the drugs, so that the boxplots for the drugs "Capomulin" and "Ramicane" appear on the left. Note: Look at the matplotlib gallery to understand how to create a side-by-side boxplot. Hint: start with a list of lists of values you want to plot. : # YOUR CODE HERE raise NotImplementedError()
Step by Step Solution
There are 3 Steps involved in it

Get step-by-step solutions from verified subject matter experts