

Question: Please answer all...(10) This I The data in the table to the right represent the calories and sugar (in grams) in one serving of seven
Please answer all...(10)
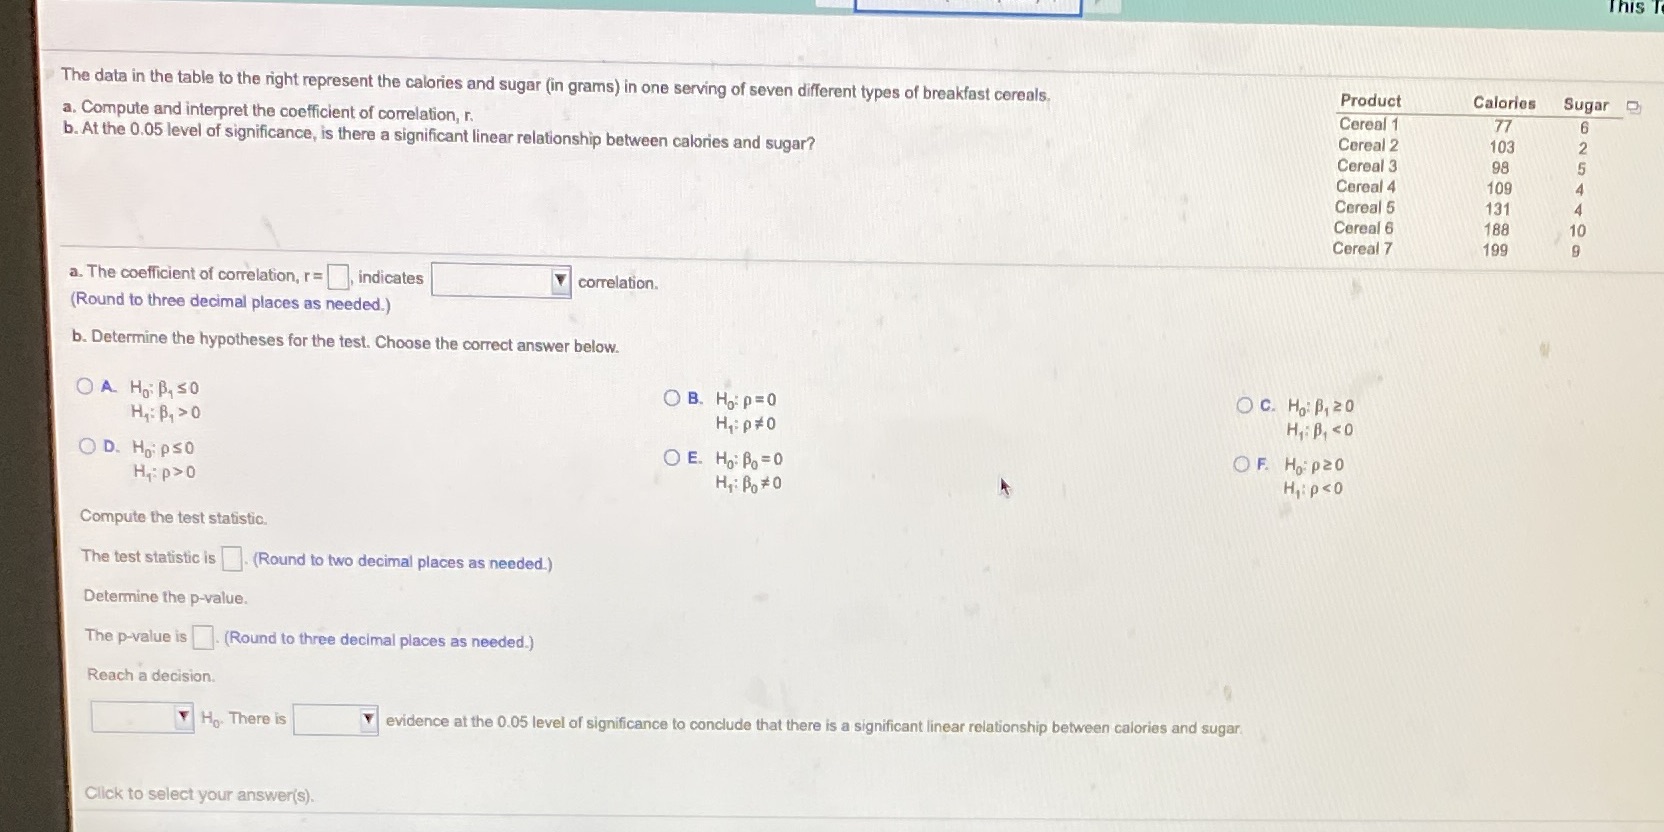
This I The data in the table to the right represent the calories and sugar (in grams) in one serving of seven different types of breakfast cereals, Product Calories Sugar a. Compute and interpret the coefficient of correlation, r. Cereal 1 77 b. At the 0.05 level of significance, is there a significant linear relationship between calories and sugar? Cereal 2 103 Cereal 3 98 Cereal 4 109 Cereal 5 131 Cereal 6 188 10 Cereal 7 199 a. The coefficient of correlation, r= , indicates correlation. (Round to three decimal places as needed.) b. Determine the hypotheses for the test. Choose the correct answer below. O A Hoi B, SO OB. Ho: P=0 O C. Ho: B, 20 H,: B, >O Hip#O OD. Hoipso OE. Ho: Bo= 0 OF. Hopzo Hy: p>0 H,: Bo # 0 Compute the test statistic. The test statistic is (Round to two decimal places as needed.) Determine the p-value. The p-value is .(Round to three decimal places as needed.) Reach a decision. Y Ho. There is evidence at the 0.05 level of significance to conclude that there is a significant linear relationship between calories and sugar. Click to select your answer(s)
Step by Step Solution
There are 3 Steps involved in it

Get step-by-step solutions from verified subject matter experts