

Question: ............ The data in the table to the right represent the calories and sugar (in grams) in one serving of seven different types of breakfast
............
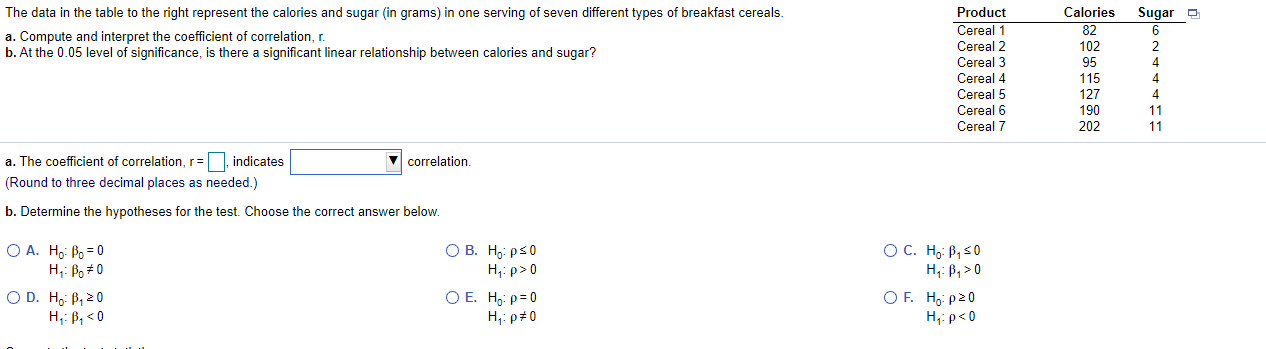
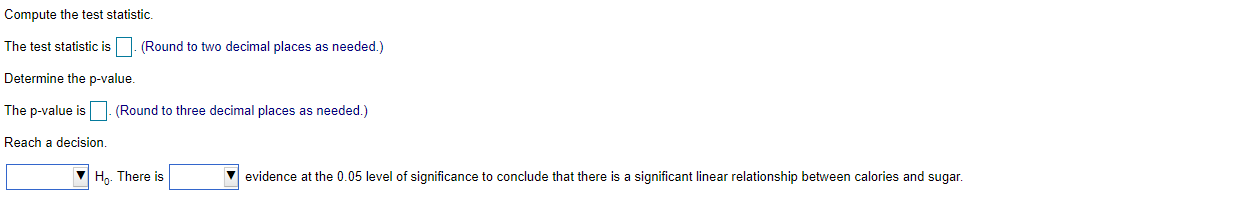
The data in the table to the right represent the calories and sugar (in grams) in one serving of seven different types of breakfast cereals. Product Calories Sugar a. Compute and interpret the coefficient of correlation, r. Cereal 1 82 b. At the 0.05 level of significance, is there a significant linear relationship between calories and sugar? Cereal 2 102 Cereal 3 95 AAANO Cereal 4 115 Cereal 5 127 Cereal 6 190 11 Cereal 7 202 11 a. The coefficient of correlation, r= , indicates correlation. (Round to three decimal places as needed.) b. Determine the hypotheses for the test. Choose the correct answer below. OA. Ho: Po = 0 OB. Hypso O C. Ho: B, SO H: Bo # 0 H, : p>0 H,: B, 20 OD. Ho: B, 20 OE. Hop = 0 OF. Ho: p 20 Hy : B,
Step by Step Solution
There are 3 Steps involved in it

Get step-by-step solutions from verified subject matter experts