

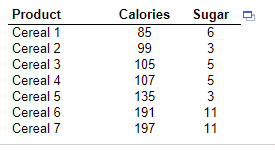
Question: The data in the table to the right represent the calories and sugar?(in grams) in one serving of seven different types of breakfast cereals. a.
The data in the table to the right represent the calories and sugar?(in grams) in one serving of seven different types of breakfast cereals.
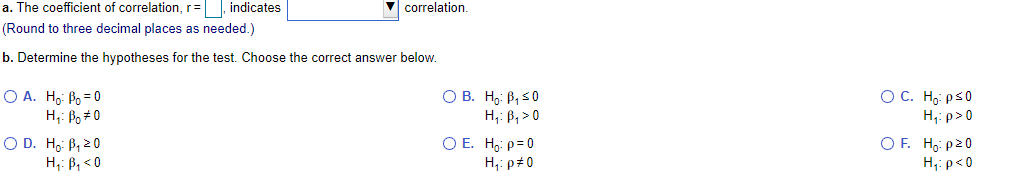
a. Compute and interpret the coefficient of?correlation, r.
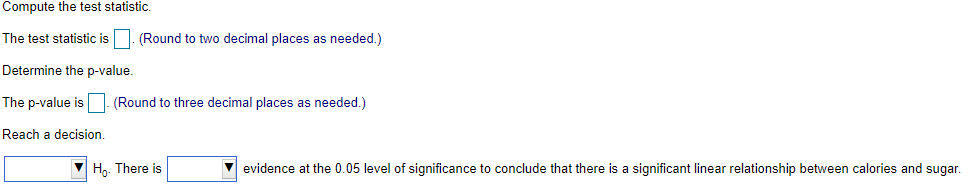
b. At the 0.05 level of?significance, is there a significant linear relationship between calories and?sugar?
\f\f\f
Step by Step Solution
There are 3 Steps involved in it
1 Expert Approved Answer
Step: 1 Unlock

Question Has Been Solved by an Expert!
Get step-by-step solutions from verified subject matter experts
Step: 2 Unlock
Step: 3 Unlock