

Question: please help me with these steps b) What are the control imits for the range chart? UCLR=0.94 ounces (round your response to two decimal places).
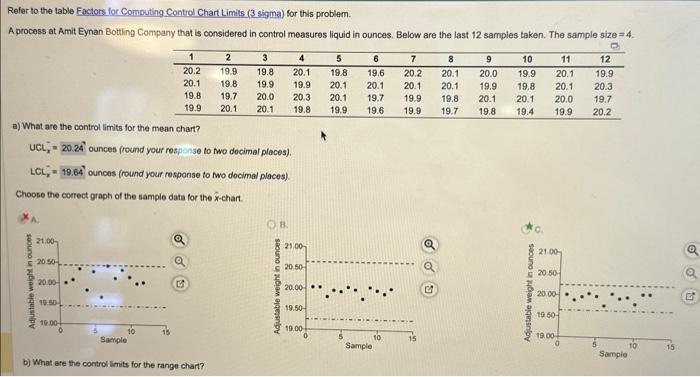
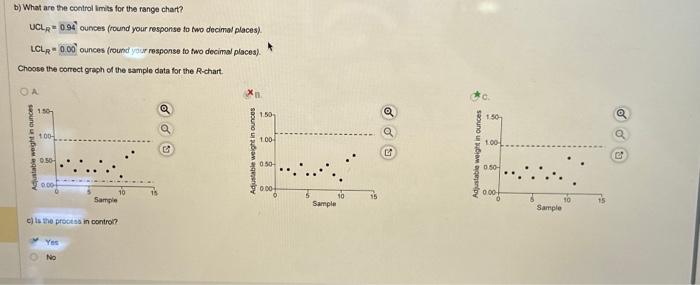
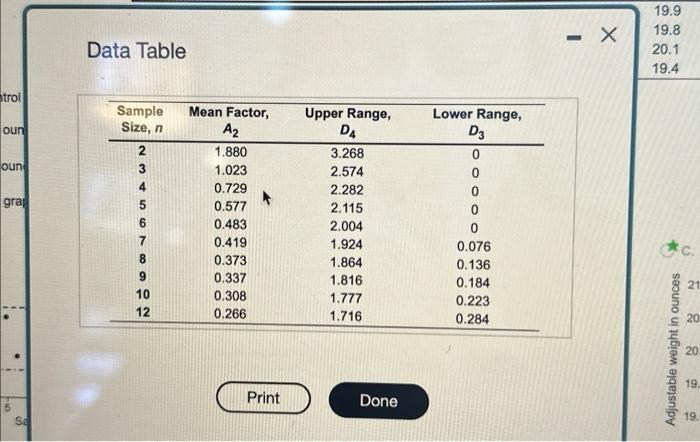
b) What are the control imits for the range chart? UCLR=0.94 ounces (round your response to two decimal places). LCLR=0.00 ' ounces (round your response to two decimal places). Choose the correct graph of the sample data for the R-chart. c) ts the prostso in contron? No Data Table Refer to the table Factors for Computing Control Chart Limits ( 3 sigma) for this problem. A process at Amit Eynan Bottling Company that is considered in control measures liquid in ounces. Below are the last 12 samples taken. The sample size =4. a) What are the control limits for the mean chart? UCLx=20.24 ounces (round your response to two decimal places). LCLx= ounces (round your response to fwo docimal places). Choose the correct graph of the sample data for the x-chart. xa b) What are the control limits for the range chart
Step by Step Solution
There are 3 Steps involved in it

Get step-by-step solutions from verified subject matter experts