

Question: Please answer c and d Check my work 11 Line Graph A O Line Graph B O Line Graph C O Line Graph D (b)
Please answer c and d
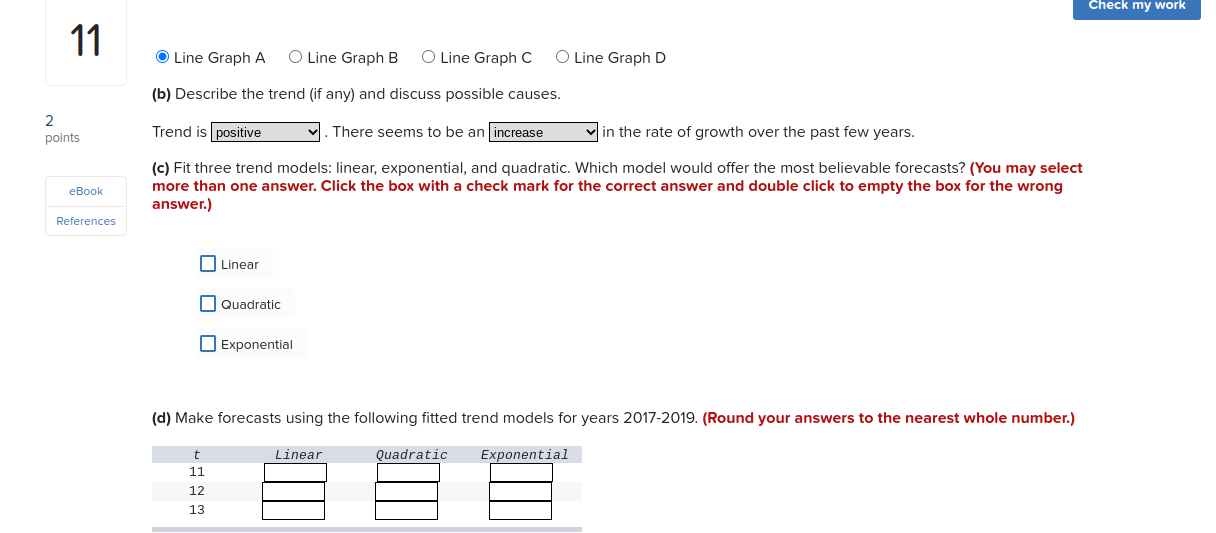

Check my work 11 Line Graph A O Line Graph B O Line Graph C O Line Graph D (b) Describe the trend (if any) and discuss possible causes. 2 points Trend is positive . There seems to be an increase in the rate of growth over the past few years. (c) Fit three trend models: linear, exponential, and quadratic. Which model would offer the most believable forecasts? (You may select eBook more than one answer. Click the box with a check mark for the correct answer and double click to empty the box for the wrong answer.) References Linear Quadratic Exponential (d) Make forecasts using the following fitted trend models for years 2017-2019. (Round your answers to the nearest whole number.) t Linear Quadratic Exponential 11 12 1311 poms _n__._ ".5. civilian Labor Force (thousands) YEar 266? 2666 2666 2616 2611 Labor Force 153,915 154,555 153,111 153,555 153,995 YEar 2612 2613 2614 2615 2615 Labor Farce 155,628 155,151 156,238 15?,95? 159,545
Step by Step Solution
There are 3 Steps involved in it

Get step-by-step solutions from verified subject matter experts