

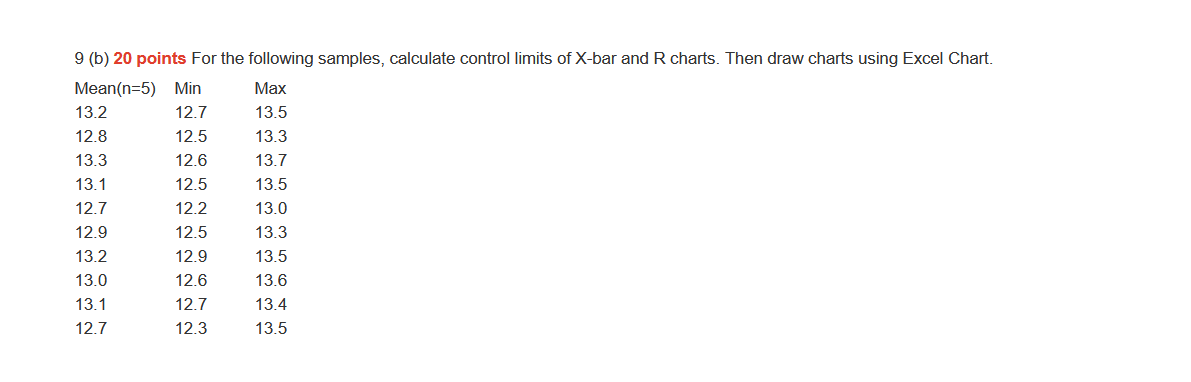
Question: Please answer for me! thank you!/ 9 (b) 20 points For the following samples, calculate control limits of X-bar and R charts. Then draw charts
Please answer for me! thank you!/
Step by Step Solution
There are 3 Steps involved in it
1 Expert Approved Answer
Step: 1 Unlock

Question Has Been Solved by an Expert!
Get step-by-step solutions from verified subject matter experts
Step: 2 Unlock
Step: 3 Unlock