

Question: Please answer for year 2016, 2017, 2018, and 2019 See Table 2.5 5 showing financial statement data and stock price data for Mydeco Corp. Suppose
Please answer for year 2016, 2017, 2018, and 2019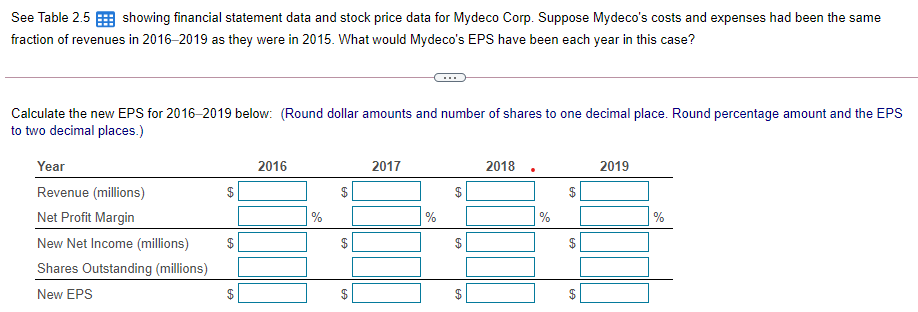
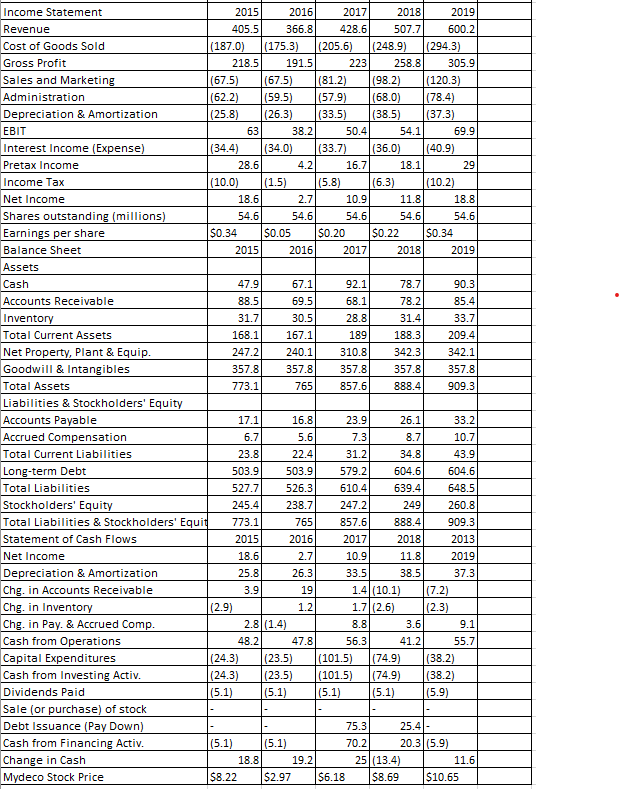
See Table 2.5 5 showing financial statement data and stock price data for Mydeco Corp. Suppose Mydeco's costs and expenses had been the same fraction of revenues in 2016-2019 as they were in 2015. What would Mydeco's EPS have been each year in this case? Calculate the new EPS for 2016-2019 below: (Round dollar amounts and number of shares to one decimal place. Round percentage amount and the EPS to two decimal places.) 2016 2017 2018. 2019 % % % % Year Revenue (millions) Net Profit Margin New Net Income (millions) Shares Outstanding (millions) New EPS $ $ $ $ (675) 1 ) ON Income Statement 2015 2016 2017 2018 2019 Revenue 405.5 366.8 428.6 507.7 600.2 Cost of Goods Sold (187.0) (175.3) (205.6) (248.9) (294.3) Gross Profit 218.5 191.5 223 258.8 305.9 Sales and Marketing (67.5) (81.2) (98.2) (120.3) Administration (62.2) (59.5) (57.9) (68.0) (78.4) Depreciation & Amortization (25.8) (26.3) (33.5) (38.5) (37.3) EBIT 63 38.2 50.4 54.1 69.9 Interest Income (Expense) (34.4) (34.0) (33.7) (36.0) (40.9) Pretax Income 28.6 4.2 16.7 18.1 29 Income Tax (10.0) (1.5) (5.8) (6.3) (10.2) Net Income 18.6 2.7 10.91 11.8 18.8 Shares outstanding (millions) 54.6 54.6 54.6 54.6 54.6 Earnings per share $0.34 $0.05 $0.20 $0.22 $0.34 Balance Sheet 2015 2016 2017 2018 2019 Assets Cash 47.9 67.1 92.1 78.7 90.3 Accounts Receivable 88.5 69.5 68.1 78.2 85.4 Inventory 31.7 30.5 28.8 31.4 33.7 Total Current Assets 168.1 167.1 189 188.3 209.4 Net Property, Plant & Equip. 247.2 240.1 310.8 342.3 342.1 Goodwill & Intangibles 357.8 357.8 357.8 357.8 357.8 Total Assets 773.1 765 857.6 888.4 909.3 Liabilities & Stockholders' Equity Accounts Payable 17.1 16.8 23.9 26.1 33.2 Accrued Compensation 6.7 5.6 7.3 8.7 10.7 Total Current Liabilities 23.8 22.4 31.2 34.8 43.9 Long-term Debt 503.9 503.9 579.2 604.6 604.6 Total Liabilities 527.7 526.3 610.4 639.4 648.5 Stockholders' Equity 245.4 238.7 247.2 249 260.8 Total Liabilities & Stockholders' Equit 773.1 765 857.6 888.4 909.3 Statement of Cash Flows 2015 2016 2017 2018 2013 Net Income 18.6 2.7 10.9 11.8 2019 Depreciation & Amortization 25.8 26.3 33.5 38.5 37.3 Chg. in Accounts Receivable 3.9 19 1.4 (10.1) (7.2) Chg. in Inventory (2.9) 1.2 1.7(2.6) (2.3) Chg. in Pay. & Accrued Comp. 2.8 (1.4) 8.8 3.6 9.1 Cash from Operations 48.2 47.8 56.3 41.2 55.7 Capital Expenditures (24.3) (23.5) (101.5) (74.9) (38.2) Cash from Investing Activ. (24.3) (23.5) (101.5) (74.9) (38.2) Dividends Paid (5.1) (5.1) (5.1) (5.1) (5.9) Sale (or purchase) of stock Debt Issuance (Pay Down) 75.3 25.41- Cash from Financing Activ. (5.1) (5.1) 70.2 20.3 (5.9) Change in Cash 18.8 19.2 25 (13.4) 11.6 Mydeco Stock Price $8.22 $2.97 $6.18 $8.69 $10.65 una on N Ilmi
Step by Step Solution
There are 3 Steps involved in it

Get step-by-step solutions from verified subject matter experts