

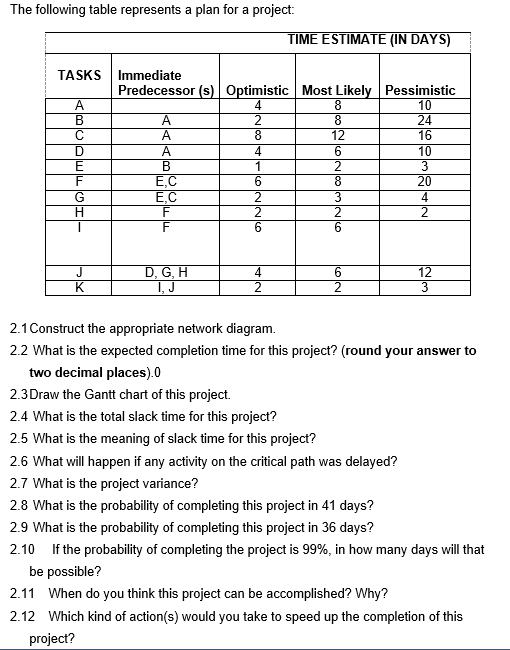
Question: PLEASE ANSWER FROM 2.6 The following table represents a plan for a project: TIME ESTIMATE (IN DAYS) TASKS Immediate Predecessor (s) Optimistic Most Likely Pessimistic
 PLEASE ANSWER FROM 2.6
The following table represents a plan for a project: TIME ESTIMATE (IN DAYS) TASKS Immediate Predecessor (s) Optimistic Most Likely Pessimistic A 4 8 10 B A 2 8 24 A 8 12 16 D A 4 6 10 E B 1 2 3 F EC 6 8 20 G EC 2 3 4 H F 2 2 2 1 F 6 J K D, G, H 4 2 6 2 12 3 2.1 Construct the appropriate network diagram. 2.2 What is the expected completion time for this project? (round your answer to two decimal places). 2.3 Draw the Gantt chart of this project. 2.4 What is the total slack time for this project? 2.5 What is the meaning of slack time for this project? 2.6 What will happen if any activity on the critical path was delayed? 2.7 What is the project variance? 2.8 What is the probability of completing this project in 41 days? 2.9 What is the probability of completing this project in 36 days? 2.10 If the probability of completing the project is 99%, in how many days will that be possible? 2.11 When do you think this project can be accomplished? Why? 2.12 Which kind of action(s) would you take to speed up the completion of this project
Step by Step Solution
There are 3 Steps involved in it
1 Expert Approved Answer
Step: 1 Unlock

Question Has Been Solved by an Expert!
Get step-by-step solutions from verified subject matter experts
Step: 2 Unlock
Step: 3 Unlock