

Question: Please answer homework 2 questions. Summary We summarize our findings for the case of an exponential QQ-plot as this will help us in pinning down
Please answer homework 2 questions.
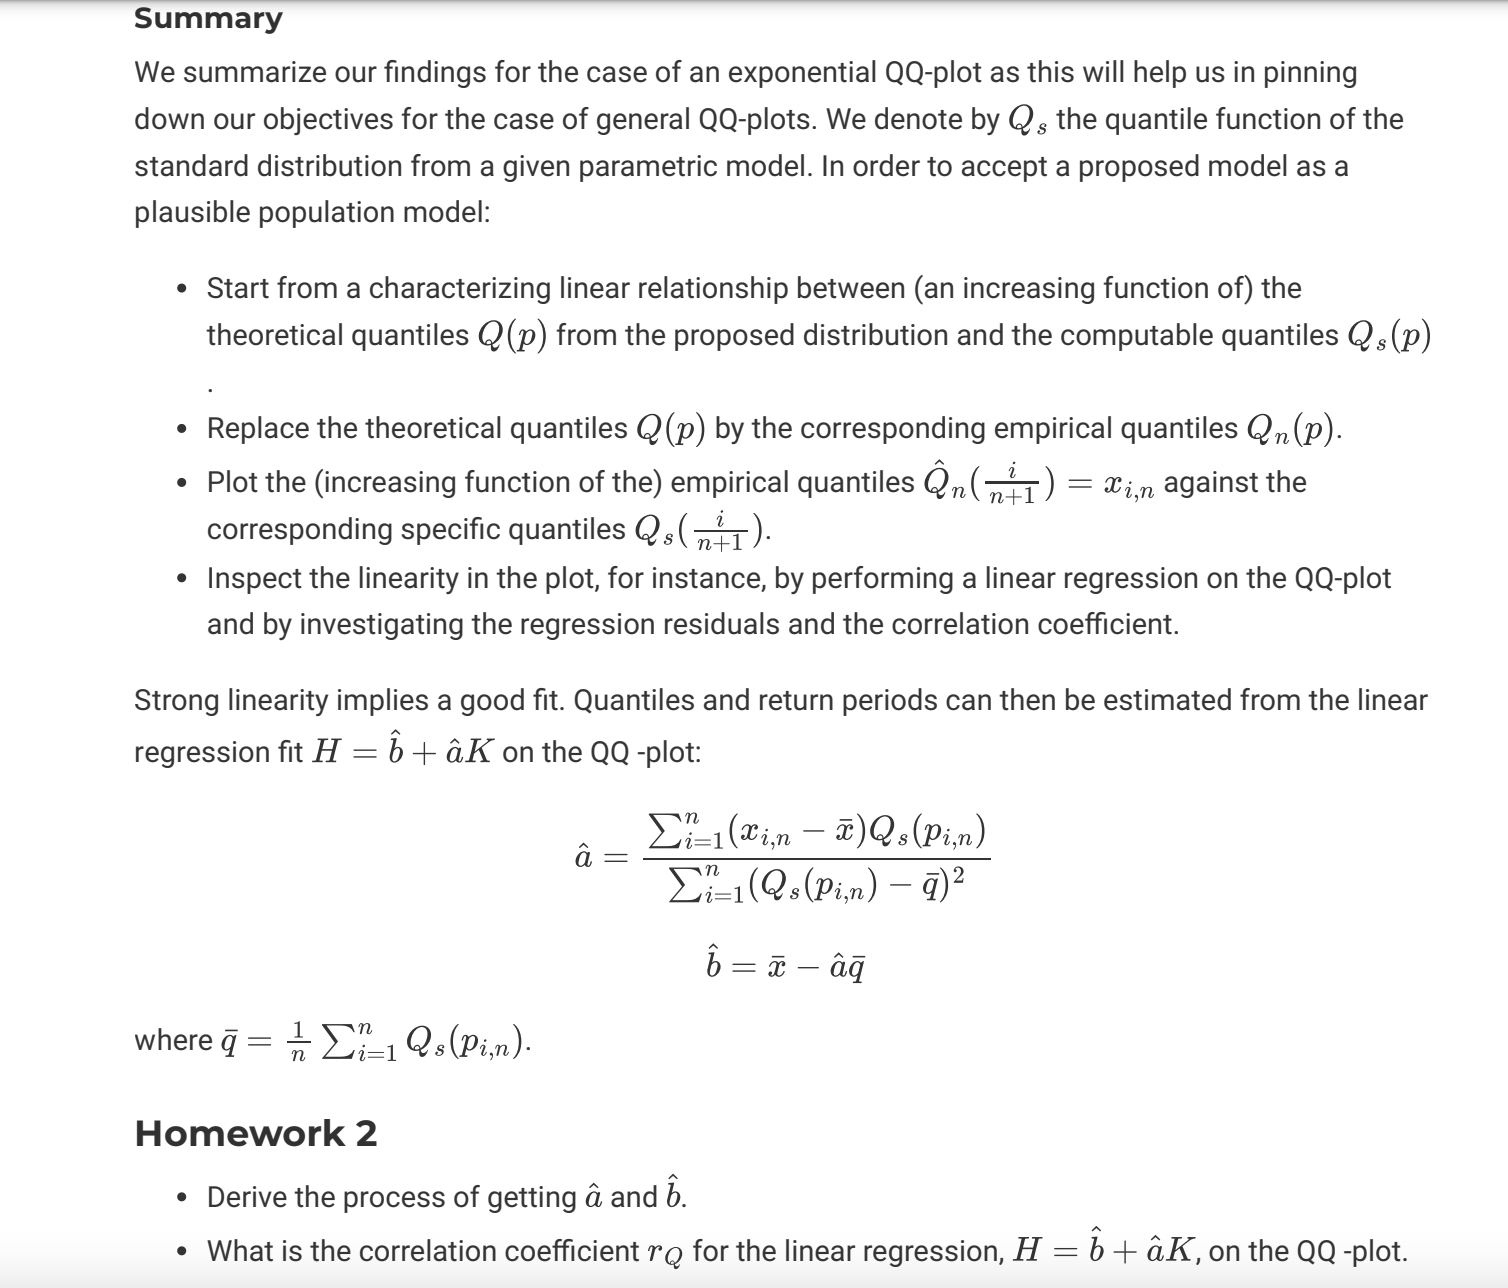
Summary We summarize our findings for the case of an exponential QQ-plot as this will help us in pinning down our objectives for the case of general QQ-plots. We denote by Q s the quantile function of the standard distribution from a given parametric model. In order to accept a proposed model as a plausible population model: . Start from a characterizing linear relationship between (an increasing function of) the theoretical quantiles Q (p) from the proposed distribution and the computable quantiles Q s (p) . Replace the theoretical quantiles Q (p) by the corresponding empirical quantiles Qn(p). . Plot the (increasing function of the) empirical quantiles On( n4 ) = Xi,n against the corresponding specific quantiles Q s ( 74I). . Inspect the linearity in the plot, for instance, by performing a linear regression on the QQ-plot and by investigating the regression residuals and the correlation coefficient. Strong linearity implies a good fit. Quantiles and return periods can then be estimated from the linear regression fit H = b + ak on the QQ -plot: a = Lil(Tin - x) Qs(Pi,n) EL-1(Qs(Pin) - q)2 b = x - aq where q = n Ei-1 Qs(Pin). Homework 2 . Derive the process of getting a and b. . What is the correlation coefficient ro for the linear regression, H = b + ak, on the QQ -plot
Step by Step Solution
There are 3 Steps involved in it

Get step-by-step solutions from verified subject matter experts