

Question: #Please Answer in Python Codeblock A) Download the .csv files (CurrentPrices, EmploymentRate, ProductionVolume, and Sales) linked on Canvas on the assignment page and place them
#Please Answer in Python Codeblock
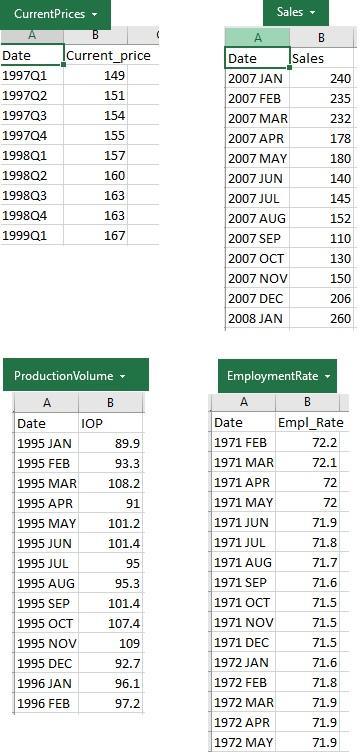
A) Download the .csv files (CurrentPrices, EmploymentRate, ProductionVolume, and Sales) linked on Canvas on the assignment page and place them in a local repository alongside your notebook file. (If on Google Colab, upload the files to the colab.) Use Pandas to read each .csv file into its own variable.
After inspecting the first few rows of each data frame, clean up each data frame by converting the Date column to Datetime objects, then setting the index of the data frame to be the Date values to convert the data frame into a series.
Plot each dataset with an appropriate title, either individually in separate code cells or all together in a single plot using subplots.
B)
Based on the plots you created in part (a), determine which pattern each dataset falls into and suggest a corresponding forecasting technique to match each pattern. For pattern and forecasting technique, limit your choice to the following options:
Patterns: Horizontal, Trend, Seasonal without Trend, Seasonal with Trend
Forecasting Technique: Naive Forecasting, Moving Average Smoothing, Exponential Smoothing, Regression Analysis, Regression Analysis with Dummy Variables
To answer this question, EDIT THIS TEXT CELL by replacing the x's below with your answers (as opposed to typing in a code cell).
| Dataset | Pattern | Forecasting Technique |
|---|---|---|
| CurrentPrice | x | x |
| EmploymentRate | x | x |
| ProductionVolume | x | x |
| Sales | x | x |
Sales A B CurrentPrices B Date Current_price 199701 149 199702 151 199703 154 199704 155 1998Q1 157 199802 160 1998Q3 163 199804 163 199901 167 Date Sales 2007 JAN 240 2007 FEB 235 2007 MAR 232 2007 APR 178 2007 MAY 180 2007 JUN 140 2007 JUL 145 2007 AUG 152 2007 SEP 110 2007 OCT 130 2007 NOV 150 2007 DEC 206 2008 JAN 260 ProductionVolume A B Date IOP 1995 JAN 89.9 1995 FEB 93.3 1995 MAR 108.2 1995 APR 91 1995 MAY 101.2 1995 JUN 101.4 1995 JUL 95 1995 AUG 95.3 1995 SEP 101.4 1995 OCT 107.4 1995 NOV 109 1995 DEC 92.7 1996 JAN 96.1 1996 FEB 97.2 EmploymentRate A B Date Empl_Rate 1971 FEB 72.2 1971 MAR 72.1 1971 APR 72 1971 MAY 72 1971 JUN 71.9 1971 JUL 71.8 1971 AUG 71.7 1971 SEP 71.6 1971 OCT 71.5 1971 NOV 71.5 1971 DEC 71.5 1972 JAN 71.6 1972 FEB 71.8 1972 MAR 71.9 1972 APR 71.9 1972 MAY 71.9
Step by Step Solution
There are 3 Steps involved in it

Get step-by-step solutions from verified subject matter experts