

Question: please answer number 2 (worth 7 points) from the bottom photo in the way of the example given in the first photo of the source
please answer number 2 (worth 7 points) from the bottom photo in the way of the example given in the first photo of the source of variation and df table (A1 A2, B1 B2). However, fitting the design elements from question 2.
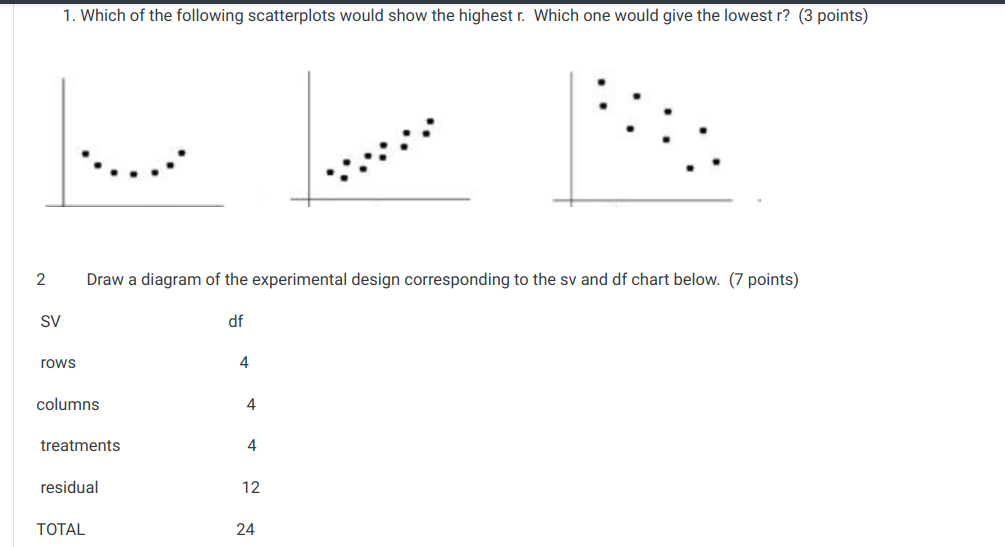
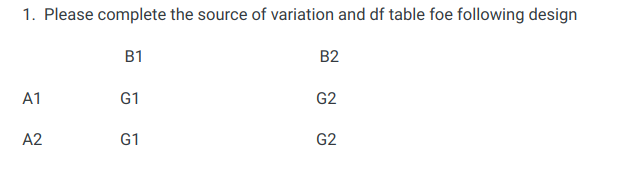
1. which of the following scatterplots would show the highest r. which one would give the lowest r? (3 points} 2 Draw a diagram of the experimental design corresponding to the Si: and df chart below. [7 points) 8V df rows 4 columns 4 treatments 4 residual 12 TOTAL 24 1. Please complete the source of variation and of table foe following design B1 B2 A1 G1 G2 A2 G1 G2
Step by Step Solution
There are 3 Steps involved in it
1 Expert Approved Answer
Step: 1 Unlock

Question Has Been Solved by an Expert!
Get step-by-step solutions from verified subject matter experts
Step: 2 Unlock
Step: 3 Unlock