

Question: please answer part D and F PLEASE CODE IN R TO SHOW WORK SNOW 11.150 Snow geese feeding trial. Botanists at the University of Toronto


please answer part D and F PLEASE CODE IN R TO SHOW WORK
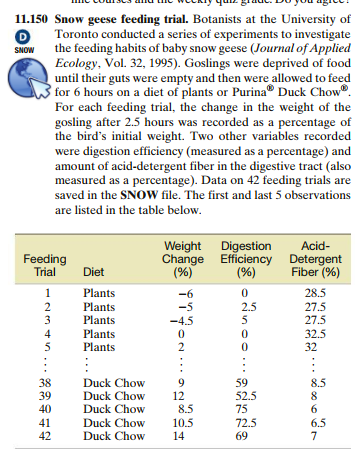
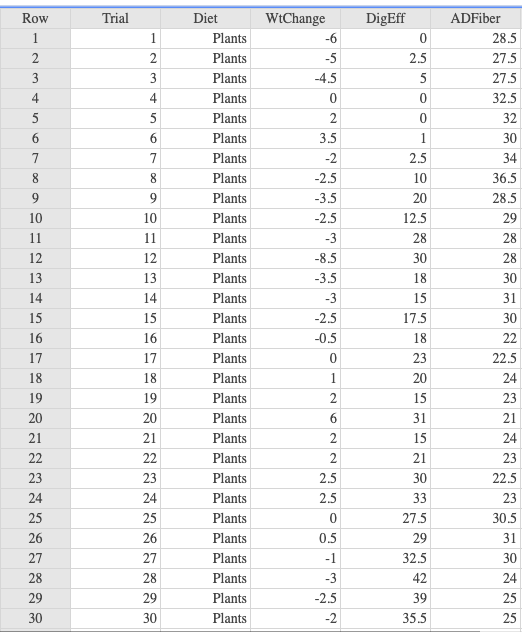
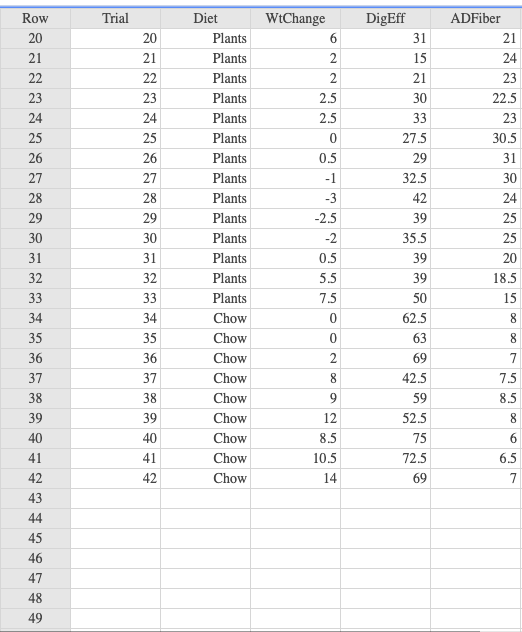
SNOW 11.150 Snow geese feeding trial. Botanists at the University of Toronto conducted a series of experiments to investigate the feeding habits of baby snow geese (Journal of Applied Ecology, Vol. 32, 1995). Goslings were deprived of food until their guts were empty and then were allowed to feed for 6 hours on a diet of plants or Purina Duck Chow For each feeding trial, the change in the weight of the gosling after 2.5 hours was recorded as a percentage of the bird's initial weight. Two other variables recorded were digestion efficiency (measured as a percentage) and amount of acid-detergent fiber in the digestive tract (also measured as a percentage). Data on 42 feeding trials are saved in the SNOW file. The first and last 5 observations are listed in the table below. Feeding Trial Weight Digestion Acid- Change Efficiency Detergent (%) (%) Fiber (%) -6 0 28.5 -5 2.5 27.5 -4.5 5 27.5 0 0 32.5 2 0 32 Diet Plants Plants Plants Plants Plants 2 3 4 5 . ... ... 38 39 40 41 42 Duck Chow Duck Chow Duck Chow Duck Chow Duck Chow 9 12 8.5 10.5 14 59 52.5 75 72.5 69 8.5 8 6 6.5 7 Row Trial DigEff 1 0 2 2 2.5 5 WtChange -6 -5 -4.5 0 2 3.5 3 ADFiber 28.5 27.5 27.5 32.5 32 30 34 4 4 0 5 5 0 5 6 ON 7 2 8 8 36.5 9 28.5 29 28 28 30 -2.5 -3.5 -2.5 -3 -8.5 -3.5 -3 -2.5 -0.5 0 31 10 11 12 13 14 15 16 17 18 19 20 21 Diet Plants Plants Plants Plants Plants Plants Plants Plants Plants Plants Plants Plants Plants Plants Plants Plants Plants Plants Plants Plants Plants Plants Plants Plants Plants Plants Plants Plants Plants Plants 30 9 10 11 12 13 14 15 16 17 18 19 20 21 22 23 24 25 26 27 28 29 30 1 2.5 10 20 12.5 28 30 18 15 17.5 18 23 20 15 31 15 21 30 33 27.5 29 32.5 42 39 35.5 2 6 2 22 2 2.5 23 24 25 26 27 28 22 22.5 24 23 21 24 23 22.5 23 30.5 31 30 24 25 25 2.5 0 0.5 -1 -3 -2.5 29 30 N Trial WtChange ON ADFiber 21 24 23 2 Row 20 21 22 23 24 25 26 27 2 2.5 2.5 22.5 0 23 30.5 31 30 24 25 28 25 20 21 22 23 24 25 26 27 28 29 30 31 32 33 34 35 36 37 38 39 40 41 42 29 30 31 32 33 34 35 36 37 38 39 Diet Plants Plants Plants Plants Plants Plants Plants Plants Plants Plants Plants Plants Plants Plants Chow Chow Chow Chow Chow Chow Chow Chow Chow 0.5 -1 -3 -2.5 -2 0.5 5.5 7.5 0 DigEff 31 15 21 30 33 27.5 29 32.5 42 39 35.5 39 39 50 62.5 63 69 42.5 59 52.5 75 72.5 69 20 18.5 15 8 0 8 7 2 8 5 9 12 8.5 10.5 7.5 8.5 8 6 6.5 7 40 41 42 14 43 44 45 46 47 48 49 f. Find and interpret a 95% prediction interval for y when x1 = 10 and x2 = 30. d. Check that the model is appropriate by investigating the residuals and the residual plot. SNOW 11.150 Snow geese feeding trial. Botanists at the University of Toronto conducted a series of experiments to investigate the feeding habits of baby snow geese (Journal of Applied Ecology, Vol. 32, 1995). Goslings were deprived of food until their guts were empty and then were allowed to feed for 6 hours on a diet of plants or Purina Duck Chow For each feeding trial, the change in the weight of the gosling after 2.5 hours was recorded as a percentage of the bird's initial weight. Two other variables recorded were digestion efficiency (measured as a percentage) and amount of acid-detergent fiber in the digestive tract (also measured as a percentage). Data on 42 feeding trials are saved in the SNOW file. The first and last 5 observations are listed in the table below. Feeding Trial Weight Digestion Acid- Change Efficiency Detergent (%) (%) Fiber (%) -6 0 28.5 -5 2.5 27.5 -4.5 5 27.5 0 0 32.5 2 0 32 Diet Plants Plants Plants Plants Plants 2 3 4 5 . ... ... 38 39 40 41 42 Duck Chow Duck Chow Duck Chow Duck Chow Duck Chow 9 12 8.5 10.5 14 59 52.5 75 72.5 69 8.5 8 6 6.5 7 Row Trial DigEff 1 0 2 2 2.5 5 WtChange -6 -5 -4.5 0 2 3.5 3 ADFiber 28.5 27.5 27.5 32.5 32 30 34 4 4 0 5 5 0 5 6 ON 7 2 8 8 36.5 9 28.5 29 28 28 30 -2.5 -3.5 -2.5 -3 -8.5 -3.5 -3 -2.5 -0.5 0 31 10 11 12 13 14 15 16 17 18 19 20 21 Diet Plants Plants Plants Plants Plants Plants Plants Plants Plants Plants Plants Plants Plants Plants Plants Plants Plants Plants Plants Plants Plants Plants Plants Plants Plants Plants Plants Plants Plants Plants 30 9 10 11 12 13 14 15 16 17 18 19 20 21 22 23 24 25 26 27 28 29 30 1 2.5 10 20 12.5 28 30 18 15 17.5 18 23 20 15 31 15 21 30 33 27.5 29 32.5 42 39 35.5 2 6 2 22 2 2.5 23 24 25 26 27 28 22 22.5 24 23 21 24 23 22.5 23 30.5 31 30 24 25 25 2.5 0 0.5 -1 -3 -2.5 29 30 N Trial WtChange ON ADFiber 21 24 23 2 Row 20 21 22 23 24 25 26 27 2 2.5 2.5 22.5 0 23 30.5 31 30 24 25 28 25 20 21 22 23 24 25 26 27 28 29 30 31 32 33 34 35 36 37 38 39 40 41 42 29 30 31 32 33 34 35 36 37 38 39 Diet Plants Plants Plants Plants Plants Plants Plants Plants Plants Plants Plants Plants Plants Plants Chow Chow Chow Chow Chow Chow Chow Chow Chow 0.5 -1 -3 -2.5 -2 0.5 5.5 7.5 0 DigEff 31 15 21 30 33 27.5 29 32.5 42 39 35.5 39 39 50 62.5 63 69 42.5 59 52.5 75 72.5 69 20 18.5 15 8 0 8 7 2 8 5 9 12 8.5 10.5 7.5 8.5 8 6 6.5 7 40 41 42 14 43 44 45 46 47 48 49 f. Find and interpret a 95% prediction interval for y when x1 = 10 and x2 = 30. d. Check that the model is appropriate by investigating the residuals and the residual plotStep by Step Solution
There are 3 Steps involved in it
1 Expert Approved Answer
Step: 1 Unlock

Question Has Been Solved by an Expert!
Get step-by-step solutions from verified subject matter experts
Step: 2 Unlock
Step: 3 Unlock