Question: please answer question 1 and 2 in an excel and managerial report including all steps And Q #'s. please make sure they are large enough
please answer question 1 and 2 in an excel and managerial report including all steps And Q #'s.
please make sure they are large enough in size( readable).
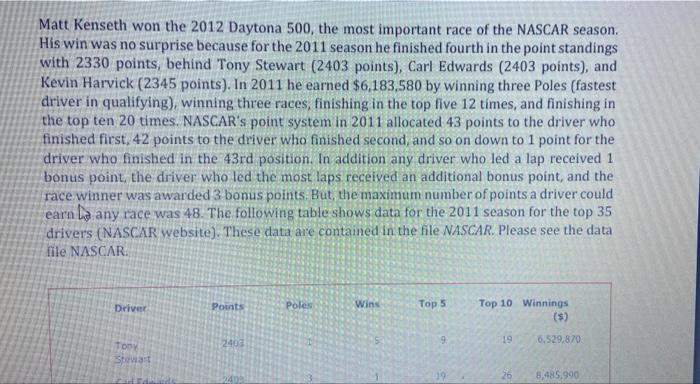
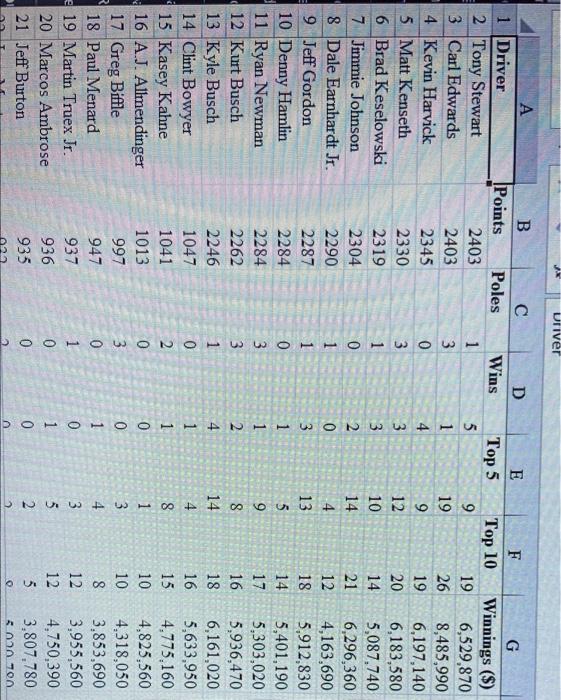
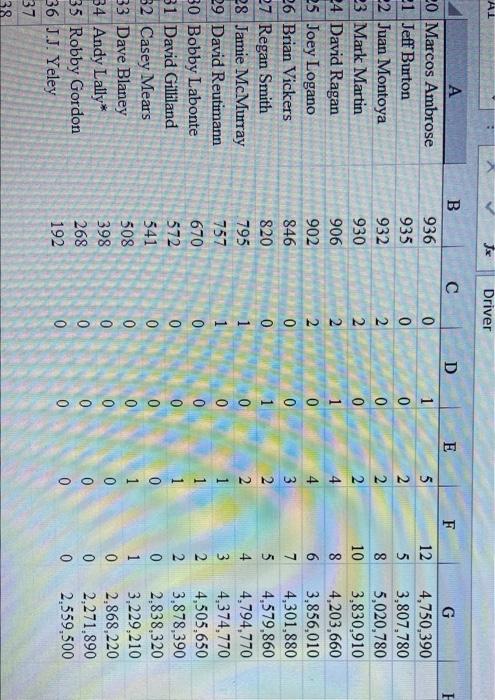
Matt Kenseth won the 2012 Daytona 500, the most important race of the NASCAR season. His win was no surprise because for the 2011 season he finished fourth in the point standings with 2330 points, behind Tony Stewart (2403 points), Carl Edwards (2403 points), and Kevin Harvick (2345 points). In 2011 he earned $6,183,580 by winning three Poles (fastest driver in qualifying), winning three races, finishing in the top five 12 times, and finishing in the top ten 20 times, NASCAR's point system in 2011 allocated 43 points to the driver who finished first. 42 points to the driver who finished second, and so on down to 1 point for the driver who finished in the 43rd position. In addition any driver who led a lap received 1 bonus point, the driver who led the most laps received an additional bonus point, and the race winner was awarded 3 bonus points. But, the maximum number of points a driver could earn Do any race was 48. The following table shows data for the 2011 season for the top 35 drivers (NASCAR website). These data are conta ed in the file NASCAR. Please see the data file NASCAR Driver Points Poles wins Top 5 Top 10 Winnings ($) 2400 9 19 6,529,870 Tony Stewart 26 8,485.990 Managerial Report 1. Suppose you wanted to predict Winnings ($) using only the number of poles won (Poles), the number of wins (Wins), the number of top five finishes (Top 5), or the number of top ten finishes (Top 10). Which of these four variables provides the best single predictor of Winnings? (20%) 2. Develop an estimated regression equation that can be used to predict Winnings ($) given the number of poles won (Poles), the number of wins (Wins), the number of top five finishes (Top 5), and the number of top ten finishes (Top 10). Test for individual significance and discuss your findings and conclusions. (20%) 1 JAR Driver 26 A B 1 Driver Points Poles 2 Tony Stewart 2403 3 Carl Edwards 2403 4 Kevin Harvick 2345 5 Matt Kenseth 2330 6 Brad Keselowski 2319 7 Jimmie Johnson 2304 8 Dale Earnhardt Jr. 2290 9 Jeff Gordon 2287 10 Denny Hamlin 2284 11 Ryan Newman 2284 12 Kurt Busch 2262 13 Kyle Busch 2246 14 Clint Bowyer 1047 15 Kasey Kahne 1041 16 A.J. Allmendinger 1013 17 Greg Biffle 997 18 Paul Menard 947 19 Martin Truex Jr. 937 20 Marcos Ambrose 936 21 Jeff Burton 935 D Wins 1 3 0 3 1 0 1 1 0 3 3 1 0 2 0 3 0 1 0 0 E Top 5 5 1 4 3 3 2 0 3 1 1 2 4 1 1 0 0 1 0 1 0 F G Top 10 Winnings ($) 9 19 6,529,870 19 8,485,990 9 19 6,197,140 12 20 6,183,580 10 14 5,087,740 14 21 6,296,360 4 12 4,163,690 13 18 5,912,830 5 14 5,401,190 9 17 5,303,020 8 16 5,936,470 14 18 6,161,020 4 16 5,633,950 8 15 4,775,160 1 10 4.825,560 3 10 4.318,050 4 8 3.853,690 3 12 3,955,560 5 12 4.750,390 2 5 3,807,780 500.700 4 2 lo un AI Jx Driver C D E F I NNN 0 0 2 2 2 2 0 0 20 Marcos Ambrose -1 Jeff Burton 22 Juan Montoya 23 Mark Martin 24 David Ragan 25 Joey Logano 26 Brian Vickers 27 Regan Smith 28 Jamie McMurray 29 David Reutimann 30 Bobby Labonte 31 David Gilliland 32 Casey Mears 33 Dave Blaney 34 Andy Lally* 35 Robby Gordon 36 J.J. Yeley B 936 935 932 930 906 902 846 820 795 757 670 572 541 508 398 268 192 1 0 0 0 1 0 0 1 0 0 0 0 0 5 2 2 2 4 4 3 2 2 1 1 1 0 1 G 4,750,390 3,807,780 5,020,780 3,830,910 4,203,660 3,856,010 4,301,880 4,579,860 4,794,770 4,374,770 4,505,650 3,878,390 2.838,320 3,229,210 2.868,220 2,271,890 2,559,500 12 5 8 10 8 6 7 5 4 3 2 2 0 1 0 0 0 1 1 0 0 OOO 37 38