

Question: Please answer Question #3, step by step 2. If samples are taken every day at the same time (only at 8:30, or only at 9:30...)
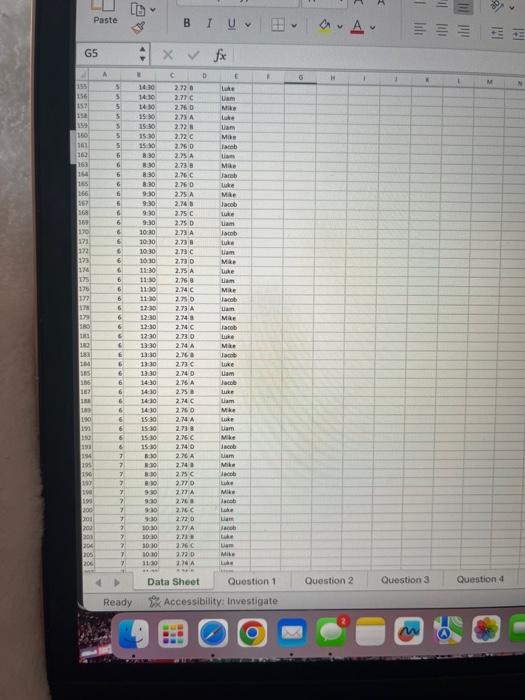
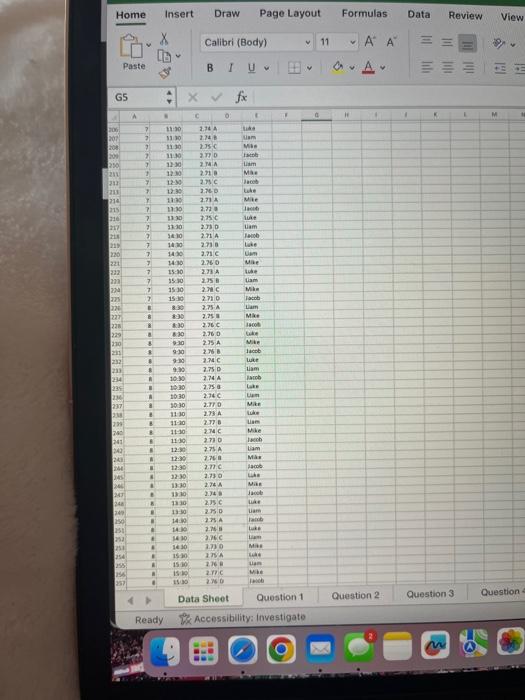
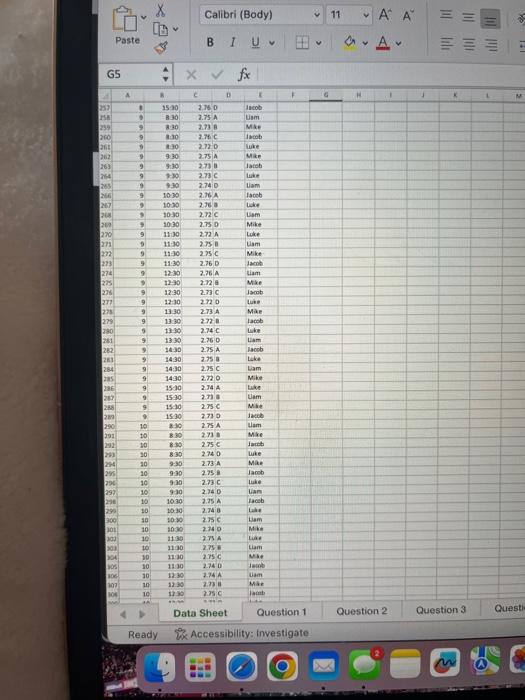
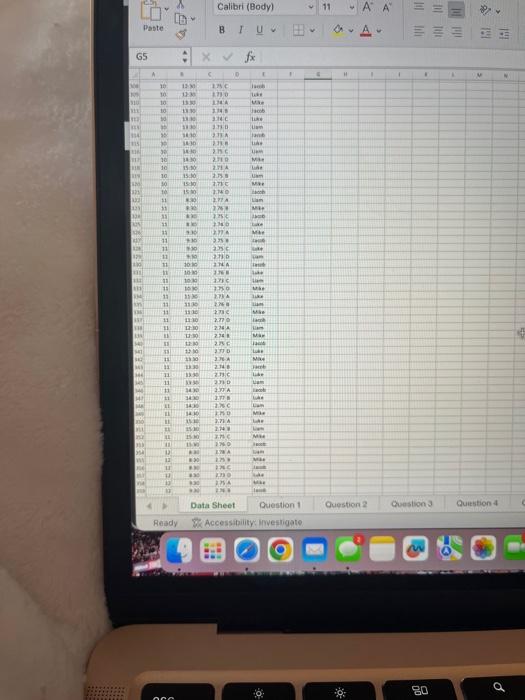
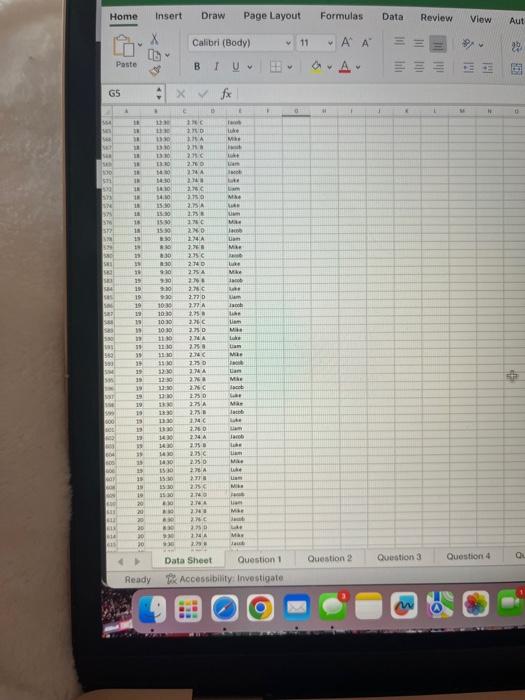
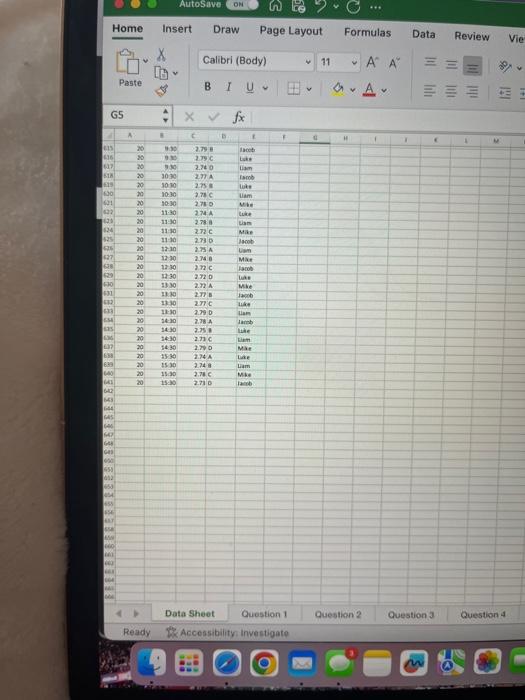
2. If samples are taken every day at the same time (only at 8:30, or only at 9:30...) which sampling times and days show the process is out of control? Use th standard table of control chart parameters to find A2, D3, and D4 values for these charts. 3. Select samples in two different groups: - Samples taken before noon. - Samples taken afternoon. Create control charts for both sampling periods, subgrouped by day. How do you compare the process output before noon and afternoon? Are they different? Ready R Accessibility: Investigate. 4. Data Sheot Question 1 Question 2 Question 3 Question 4 Ready Re Accessibility investigate 2. If samples are taken every day at the same time (only at 8:30, or only at 9:30...) which sampling times and days show the process is out of control? Use th standard table of control chart parameters to find A2, D3, and D4 values for these charts. 3. Select samples in two different groups: - Samples taken before noon. - Samples taken afternoon. Create control charts for both sampling periods, subgrouped by day. How do you compare the process output before noon and afternoon? Are they different? Ready R Accessibility: Investigate. 4. Data Sheot Question 1 Question 2 Question 3 Question 4 Ready Re Accessibility investigate
Step by Step Solution
There are 3 Steps involved in it

Get step-by-step solutions from verified subject matter experts