

Question: Please answer question 3.1 & 3.2 including steps and explanations. Annual Data 1 Millions of US $ except per share data 2011-09-30 2010-09-30 2009 Revenue
Please answer question 3.1 & 3.2 including steps and explanations.
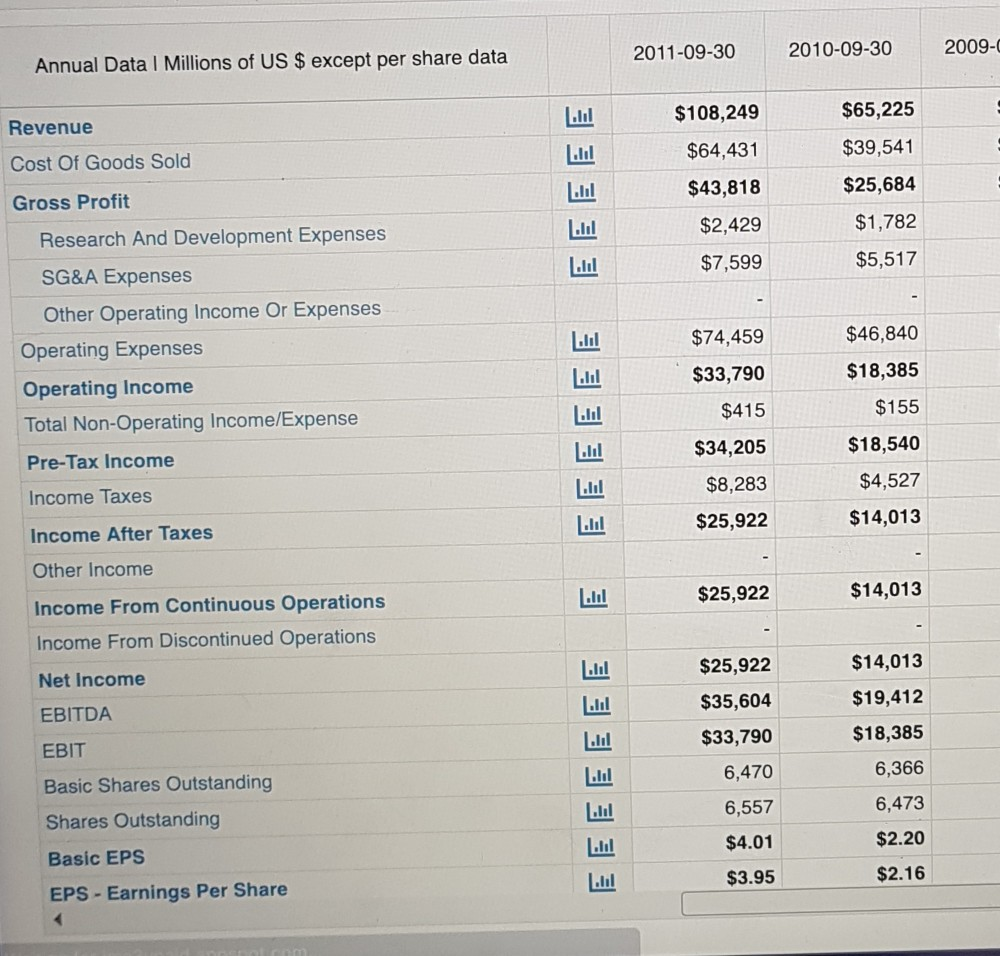
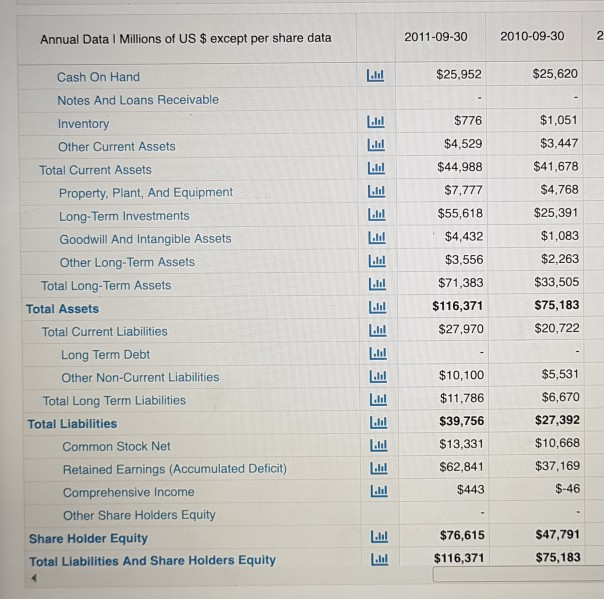
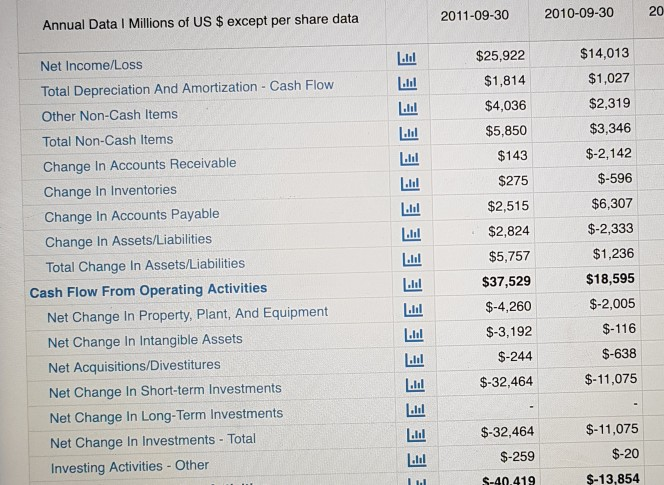
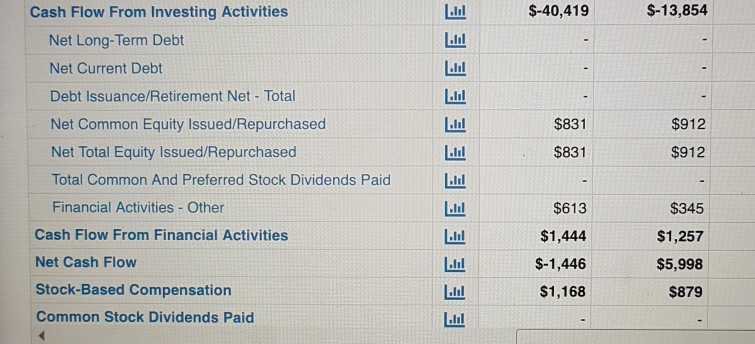
Annual Data 1 Millions of US $ except per share data 2011-09-30 2010-09-30 2009 Revenue Cost Of Goods Sold Gross Profit $108,249 $64,431 $43,818 $2,429 $7,599 $65,225 $39,541 $25,684 $1,782 $5,517 $74,459 $33,790 $415 $34,205 $8,283 $25,922 EEEEE EE EE E E E E E E E E E E Research And Development Expenses SG&A Expenses Other Operating Income Or Expenses Operating Expenses Operating Income Total Non-Operating Income/Expense Pre-Tax Income Income Taxes Income After Taxes Other Income Income From Continuous Operations Income From Discontinued Operations Net Income EBITDA EBIT Basic Shares Outstanding Shares Outstanding Basic EPS EPS - Earnings Per Share $46,840 $18,385 $155 $18,540 $4,527 $14,013 $25,922 $14,013 $25,922 $35,604 $33,790 6,470 6,557 $4.01 $14,013 $19,412 $18,385 6,366 6,473 $2.20 $3.95 $2.16 Annual Data 1 Millions of US $ except per share data 2011-09-30 2010-09-30 LUI $25,952 $25,620 Cash On Hand Notes And Loans Receivable Inventory Other Current Assets Total Current Assets Property, Plant, And Equipment Long-Term Investments Goodwill And Intangible Assets Other Long-Term Assets Total Long-Term Assets Total Assets Total Current Liabilities EEEEEEEEEEEEEEEEE $776 $4,529 $44,988 $7,777 $55,618 $4,432 $3,556 $71,383 $116,371 $27,970 $1,051 $3,447 $41,678 $4,768 $25,391 $1,083 $2,263 $33,505 $75,183 $20,722 Long Term Debt Other Non-Current Liabilities Total Long Term Liabilities Total Liabilities Common Stock Net Retained Earnings (Accumulated Deficit) Comprehensive Income Other Share Holders Equity Share Holder Equity Total Liabilities And Share Holders Equity $10,100 $11,786 $39,756 $13,331 $62,841 $443 $5,531 $6,670 $27,392 $10,668 $37,169 $-46 $76,615 $116,371 $47,791 $75,183 Annual Data 1 Millions of US $ except per share data 2011-09-30 2010-09-30 2 Net Income/Loss Total Depreciation And Amortization - Cash Flow $25,922 $1,814 $4,036 $5,850 Other Non-Cash Items $143 $275 Total Non-Cash Items Change in Accounts Receivable Change In Inventories Change in Accounts Payable Change In Assets/Liabilities Total Change In Assets/Liabilities Cash Flow From Operating Activities Net Change in Property, Plant, And Equipment Net Change In Intangible Assets Net Acquisitions/Divestitures Net Change In Short-term Investments Net Change in Long-Term Investments Net Change In Investments - Total Investing Activities - Other EEEEEEEEEEEEEEEEEE $14,013 $1,027 $2,319 $3,346 $-2,142 $-596 $6,307 $-2,333 $1,236 $18,595 $-2,005 $-116 $2,515 $2,824 $5,757 $37,529 $-4,260 $-3,192 $-244 $-32,464 $-638 $-11,075 $-32,464 $-259 $-11,075 $-20 APA $-40,419 $-13,854 $831 $831 $912 $912 Cash Flow From Investing Activities Net Long-Term Debt Net Current Debt Debt Issuance/Retirement Net - Total Net Common Equity Issued/Repurchased Net Total Equity Issued/Repurchased Total Common And Preferred Stock Dividends Paid Financial Activities - Other Cash Flow From Financial Activities Net Cash Flow Stock-Based Compensation Common Stock Dividends Paid EEEEEEEEEEEE $613 $1,444 $-1,446 $1,168 $345 $1,257 $5,998 $879 3.1 Evaluate the results of your computations in regard to the short-term liquidity for the firm. 3.2 Comment on the debt position and the trends indicated in the long-term debt-paying ability by comparing between the two years Annual Data 1 Millions of US $ except per share data 2011-09-30 2010-09-30 2009 Revenue Cost Of Goods Sold Gross Profit $108,249 $64,431 $43,818 $2,429 $7,599 $65,225 $39,541 $25,684 $1,782 $5,517 $74,459 $33,790 $415 $34,205 $8,283 $25,922 EEEEE EE EE E E E E E E E E E E Research And Development Expenses SG&A Expenses Other Operating Income Or Expenses Operating Expenses Operating Income Total Non-Operating Income/Expense Pre-Tax Income Income Taxes Income After Taxes Other Income Income From Continuous Operations Income From Discontinued Operations Net Income EBITDA EBIT Basic Shares Outstanding Shares Outstanding Basic EPS EPS - Earnings Per Share $46,840 $18,385 $155 $18,540 $4,527 $14,013 $25,922 $14,013 $25,922 $35,604 $33,790 6,470 6,557 $4.01 $14,013 $19,412 $18,385 6,366 6,473 $2.20 $3.95 $2.16 Annual Data 1 Millions of US $ except per share data 2011-09-30 2010-09-30 LUI $25,952 $25,620 Cash On Hand Notes And Loans Receivable Inventory Other Current Assets Total Current Assets Property, Plant, And Equipment Long-Term Investments Goodwill And Intangible Assets Other Long-Term Assets Total Long-Term Assets Total Assets Total Current Liabilities EEEEEEEEEEEEEEEEE $776 $4,529 $44,988 $7,777 $55,618 $4,432 $3,556 $71,383 $116,371 $27,970 $1,051 $3,447 $41,678 $4,768 $25,391 $1,083 $2,263 $33,505 $75,183 $20,722 Long Term Debt Other Non-Current Liabilities Total Long Term Liabilities Total Liabilities Common Stock Net Retained Earnings (Accumulated Deficit) Comprehensive Income Other Share Holders Equity Share Holder Equity Total Liabilities And Share Holders Equity $10,100 $11,786 $39,756 $13,331 $62,841 $443 $5,531 $6,670 $27,392 $10,668 $37,169 $-46 $76,615 $116,371 $47,791 $75,183 Annual Data 1 Millions of US $ except per share data 2011-09-30 2010-09-30 2 Net Income/Loss Total Depreciation And Amortization - Cash Flow $25,922 $1,814 $4,036 $5,850 Other Non-Cash Items $143 $275 Total Non-Cash Items Change in Accounts Receivable Change In Inventories Change in Accounts Payable Change In Assets/Liabilities Total Change In Assets/Liabilities Cash Flow From Operating Activities Net Change in Property, Plant, And Equipment Net Change In Intangible Assets Net Acquisitions/Divestitures Net Change In Short-term Investments Net Change in Long-Term Investments Net Change In Investments - Total Investing Activities - Other EEEEEEEEEEEEEEEEEE $14,013 $1,027 $2,319 $3,346 $-2,142 $-596 $6,307 $-2,333 $1,236 $18,595 $-2,005 $-116 $2,515 $2,824 $5,757 $37,529 $-4,260 $-3,192 $-244 $-32,464 $-638 $-11,075 $-32,464 $-259 $-11,075 $-20 APA $-40,419 $-13,854 $831 $831 $912 $912 Cash Flow From Investing Activities Net Long-Term Debt Net Current Debt Debt Issuance/Retirement Net - Total Net Common Equity Issued/Repurchased Net Total Equity Issued/Repurchased Total Common And Preferred Stock Dividends Paid Financial Activities - Other Cash Flow From Financial Activities Net Cash Flow Stock-Based Compensation Common Stock Dividends Paid EEEEEEEEEEEE $613 $1,444 $-1,446 $1,168 $345 $1,257 $5,998 $879 3.1 Evaluate the results of your computations in regard to the short-term liquidity for the firm. 3.2 Comment on the debt position and the trends indicated in the long-term debt-paying ability by comparing between the two years
Step by Step Solution
There are 3 Steps involved in it

Get step-by-step solutions from verified subject matter experts