

Question: Please answer Question 5. TQ 8 Question S A profit/volume (PW) chart of two companies (A and B) for a period follows Required: By reference
Please answer Question 5. TQ
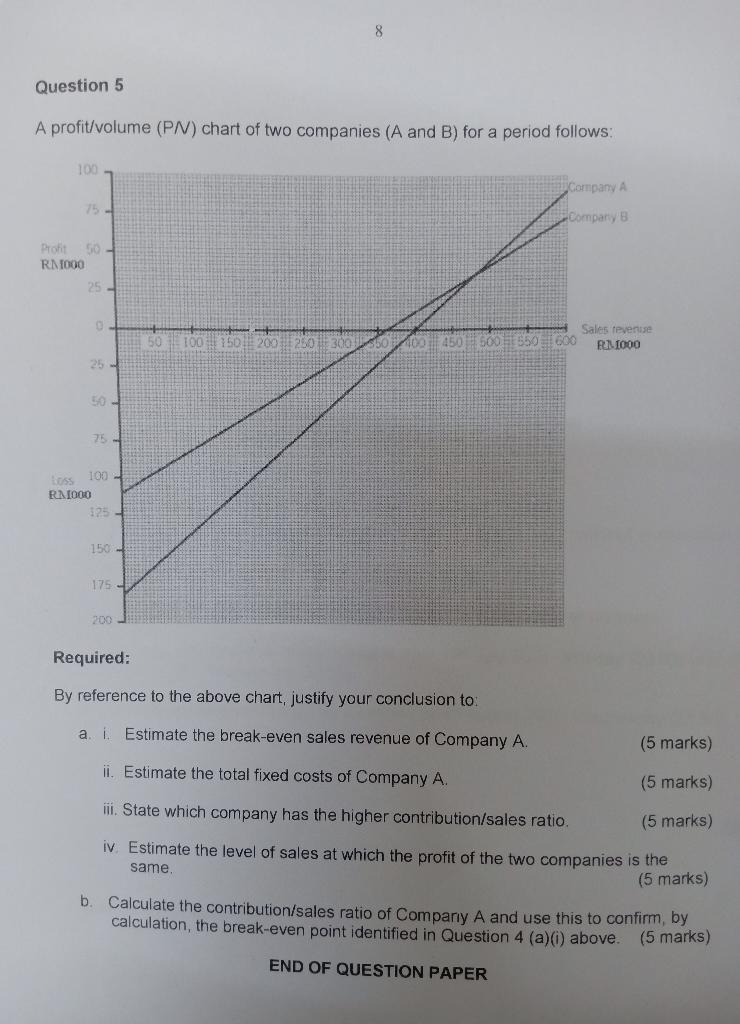
8 Question S A profit/volume (PW) chart of two companies (A and B) for a period follows Required: By reference to the above chart, justify your conclusion to: a. Estimate the break-even sales revenue of Company A. ii_ Estimate the total fixed costs of Company A. iii. State which company has the higher contribution/sales ratio, (5 marks) (5 marks) (5 marks) iv Estimate the level of sales at which the profit of the two companies is the (5 marks) same. b. Calculate the contribution/sales ratio of Company A and use this to confirm, by calculauon, the break-even point identified in Question 4 (a)(i) above, (5 marks) END OF QUESTION PAPER
Step by Step Solution
There are 3 Steps involved in it

Get step-by-step solutions from verified subject matter experts