

Question: Please answer question no 30! Thank you! A) Figure I the graphs above represents the payoff profile for a protective put strategy? B) Figure 2
Please answer question no 30! Thank you! 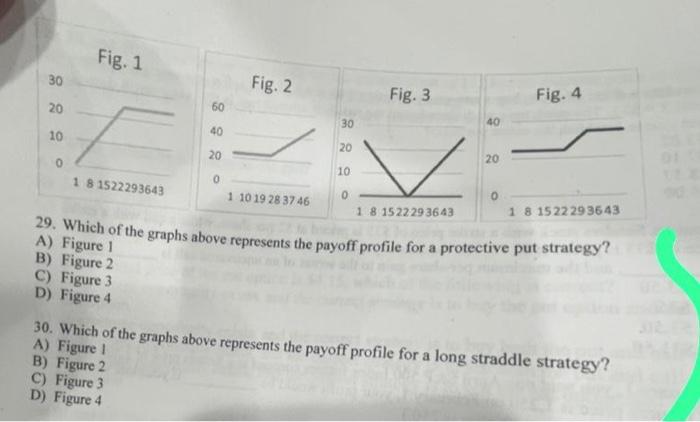
A) Figure I the graphs above represents the payoff profile for a protective put strategy? B) Figure 2 C) Figure 3 D) Figure 4 30. Which of the graphs above represents the payoff profile for a long straddle strategy? A) Figure I B) Figure 2 C) Figure 3 D) Figure 4
Step by Step Solution
There are 3 Steps involved in it
1 Expert Approved Answer
Step: 1 Unlock

Question Has Been Solved by an Expert!
Get step-by-step solutions from verified subject matter experts
Step: 2 Unlock
Step: 3 Unlock