Question: Please answer Questions in RED rectangle: Time Month 1 January 2 February 3 March 4 April 5 May 6 June 7 July 8 August 9
Please answer Questions in RED rectangle:
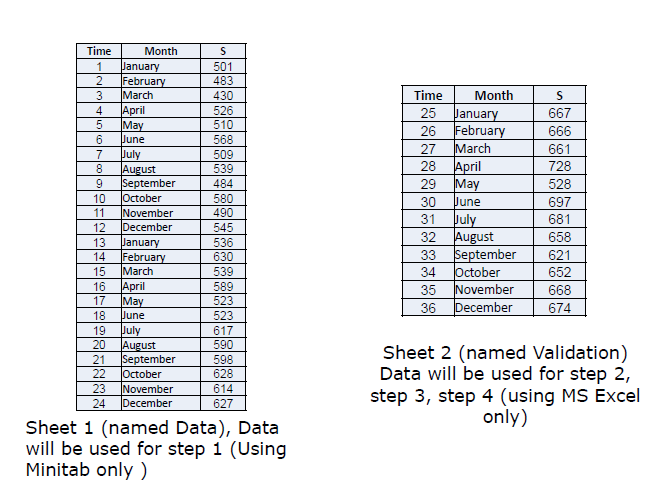
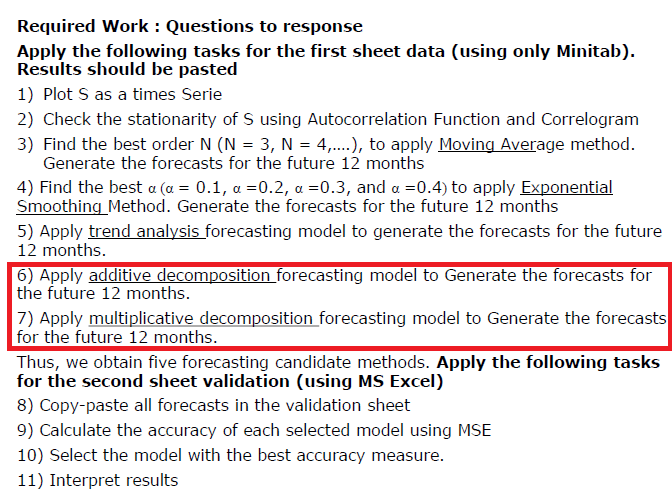
Time Month 1 January 2 February 3 March 4 April 5 May 6 June 7 July 8 August 9 September 10 October 11 November 12 December 13 January 14 February 15 March 16 April 17 May 18 June 19 July 20 August 21 September 22 October 23 November 24 December S 501 483 430 526 510 568 509 539 484 580 490 545 536 630 539 589 523 523 617 590 598 628 614 627 Time Month 25 January 26 February 27 March 28 April 29 |May 30 Pune 31 July 32 August 33 September 34 October 35 November 36 December S 667 666 661 728 528 697 681 658 621 652 668 674 Sheet 2 (named Validation) Data will be used for step 2, step 3, step 4 (using MS Excel only) Sheet 1 (named Data), Data will be used for step 1 (Using Minitab only) Required Work : Questions to response Apply the following tasks for the first sheet data (using only Minitab). Results should be pasted 1) Plot S as a times Serie 2) Check the stationarity of S using Autocorrelation Function and Correlogram 3) Find the best order N (N = 3, N = 4,....), to apply Moving Average method. Generate the forecasts for the future 12 months 4) Find the best a (a = 0.1, a =0.2, a =0.3, and a =0.4) to apply Exponential Smoothing Method. Generate the forecasts for the future 12 months 5) Apply trend analysis forecasting model to generate the forecasts for the future 12 months. 6) Apply additive decomposition forecasting model to Generate the forecasts for the future 12 months. 7) Apply multiplicative decomposition forecasting model to Generate the forecasts for the future 12 months. Thus, we obtain five forecasting candidate methods. Apply the following tasks for the second sheet validation (using MS Excel) 8) Copy-paste all forecasts in the validation sheet 9) Calculate the accuracy of each selected model using MSE 10) Select the model with the best accuracy measure. 11) Interpret results Time Month 1 January 2 February 3 March 4 April 5 May 6 June 7 July 8 August 9 September 10 October 11 November 12 December 13 January 14 February 15 March 16 April 17 May 18 June 19 July 20 August 21 September 22 October 23 November 24 December S 501 483 430 526 510 568 509 539 484 580 490 545 536 630 539 589 523 523 617 590 598 628 614 627 Time Month 25 January 26 February 27 March 28 April 29 |May 30 Pune 31 July 32 August 33 September 34 October 35 November 36 December S 667 666 661 728 528 697 681 658 621 652 668 674 Sheet 2 (named Validation) Data will be used for step 2, step 3, step 4 (using MS Excel only) Sheet 1 (named Data), Data will be used for step 1 (Using Minitab only) Required Work : Questions to response Apply the following tasks for the first sheet data (using only Minitab). Results should be pasted 1) Plot S as a times Serie 2) Check the stationarity of S using Autocorrelation Function and Correlogram 3) Find the best order N (N = 3, N = 4,....), to apply Moving Average method. Generate the forecasts for the future 12 months 4) Find the best a (a = 0.1, a =0.2, a =0.3, and a =0.4) to apply Exponential Smoothing Method. Generate the forecasts for the future 12 months 5) Apply trend analysis forecasting model to generate the forecasts for the future 12 months. 6) Apply additive decomposition forecasting model to Generate the forecasts for the future 12 months. 7) Apply multiplicative decomposition forecasting model to Generate the forecasts for the future 12 months. Thus, we obtain five forecasting candidate methods. Apply the following tasks for the second sheet validation (using MS Excel) 8) Copy-paste all forecasts in the validation sheet 9) Calculate the accuracy of each selected model using MSE 10) Select the model with the best accuracy measure. 11) Interpret results


