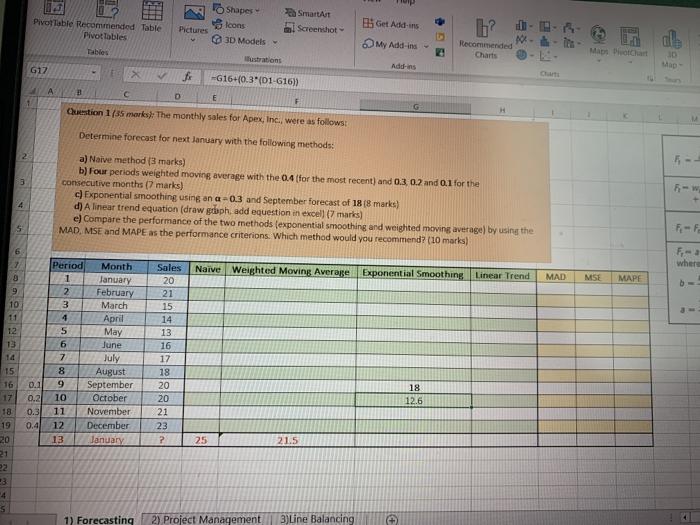
Question: solve in excel sheet with fourmula OS Add in 20 Models - Min- M Becommended Chants all Mosch rt A 10 MiD A C. E

solve in excel sheet with fourmula solve in excel sheet with fourmula OS Add in 20
solve in excel sheet with fourmula OS Add in 20
OS Add in 20 Models - Min- M Becommended Chants all Mosch rt A 10 MiD A C. E Gestion 1(15 mars the monthly sales for Apex, inc. were as follows Determine forecast for next Saray with the followmethod al Naive methods Four periods weighted moving with the 4 for the most recent and 0.2 and 0.1 for the consecutive months 17 mars Exponential smoothing03 and September forecast of 1 Altrend equation (or add question in ce mais e Compare the performance of the two methods exponenting add or the MAD MSE and MAPE as the performance criterion which method would you recommend - NAD luar Naive Weighted Moving Average where Period 1 2 3 Exponential Smoothie Linear Trend MAD ME MAPE AN a 5 6 7 R Month January February March April May June ly Ats September October November December Sales 20 21 15 14 13 16 17 18 20 20 21 23 2 18 10 02 val 0.4 10 11 12 13 25 21.5 1) Forecasting 21 Project Management Line Balancing Type here to search O II C Pivot Table Recommended Table Pivottables Shapes Icons Pictures 3D Models - Smart Screenshot Get Addins My Addins ? -- Nita Recommended Charts 05 Addins G17 -G16+0.3"(01-616)) A C D E F Question 1/35 marks: The monthly sales for Apex, Inc., were as follows: Determine forecast for next January with the following methods: -- 3 a) Naive method (3 marks) b) Four periods weighted moving average with the 04 for the most recent) and 0.3 0.2 and 0.1 for the consecutive months 7 marks) c) Exponential smoothing using an a=0.3 and September forecast of 18 (8 marks) d) A linear trend equation (draw gtbph, add equestion in excell 7 marks) e) Compare the performance of the two methods (exponential smoothing and weighted moving average) by using the MAD, MISE and MAPE as the performance criterions, which method would you recommend? (10 marks) 5 7 where Naive Weighted Moving Average Exponential Smoothing Linear Trend MAD MSE MAPE b 9 10 11 - 12 13 Period Month 1 January 2 February 3 March 4 April 5 May 6 June 7 July 8 August 9 September 10 October 11 November 12 December 13 January Sales 20 21 15 14 13 16 17 18 20 20 21 23 ? 15 16 17 18 19 0.1 0.2 0.3 0.4 18 12.6 25 21.5 20 21 22 3 4 5 1) Forecasting 2) Project Management 3) Line Balancing OS Add in 20 Models - Min- M Becommended Chants all Mosch rt A 10 MiD A C. E Gestion 1(15 mars the monthly sales for Apex, inc. were as follows Determine forecast for next Saray with the followmethod al Naive methods Four periods weighted moving with the 4 for the most recent and 0.2 and 0.1 for the consecutive months 17 mars Exponential smoothing03 and September forecast of 1 Altrend equation (or add question in ce mais e Compare the performance of the two methods exponenting add or the MAD MSE and MAPE as the performance criterion which method would you recommend - NAD luar Naive Weighted Moving Average where Period 1 2 3 Exponential Smoothie Linear Trend MAD ME MAPE AN a 5 6 7 R Month January February March April May June ly Ats September October November December Sales 20 21 15 14 13 16 17 18 20 20 21 23 2 18 10 02 val 0.4 10 11 12 13 25 21.5 1) Forecasting 21 Project Management Line Balancing Type here to search O II C Pivot Table Recommended Table Pivottables Shapes Icons Pictures 3D Models - Smart Screenshot Get Addins My Addins ? -- Nita Recommended Charts 05 Addins G17 -G16+0.3"(01-616)) A C D E F Question 1/35 marks: The monthly sales for Apex, Inc., were as follows: Determine forecast for next January with the following methods: -- 3 a) Naive method (3 marks) b) Four periods weighted moving average with the 04 for the most recent) and 0.3 0.2 and 0.1 for the consecutive months 7 marks) c) Exponential smoothing using an a=0.3 and September forecast of 18 (8 marks) d) A linear trend equation (draw gtbph, add equestion in excell 7 marks) e) Compare the performance of the two methods (exponential smoothing and weighted moving average) by using the MAD, MISE and MAPE as the performance criterions, which method would you recommend? (10 marks) 5 7 where Naive Weighted Moving Average Exponential Smoothing Linear Trend MAD MSE MAPE b 9 10 11 - 12 13 Period Month 1 January 2 February 3 March 4 April 5 May 6 June 7 July 8 August 9 September 10 October 11 November 12 December 13 January Sales 20 21 15 14 13 16 17 18 20 20 21 23 ? 15 16 17 18 19 0.1 0.2 0.3 0.4 18 12.6 25 21.5 20 21 22 3 4 5 1) Forecasting 2) Project Management 3) Line Balancing

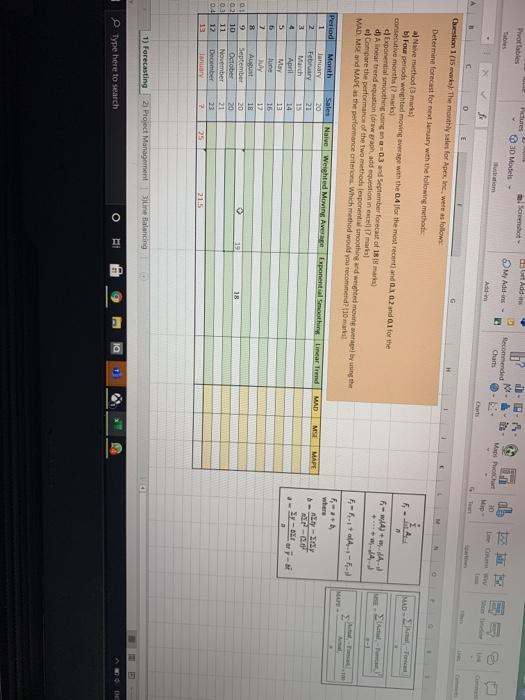
Step by Step Solution

There are 3 Steps involved in it

1 Expert Approved Answer
Step: 1 Unlock blur-text-image
Question Has Been Solved by an Expert!

Get step-by-step solutions from verified subject matter experts

Step: 2 Unlock
Step: 3 Unlock

Students Have Also Explored These Related General Management Questions!