

Question: please answer showing steps Vadim von Brzeski, Math 12 De Anza College 15. OPTIONAL EXTRA CREDIT (15 pts): In this problem we will look at
please answer showing steps
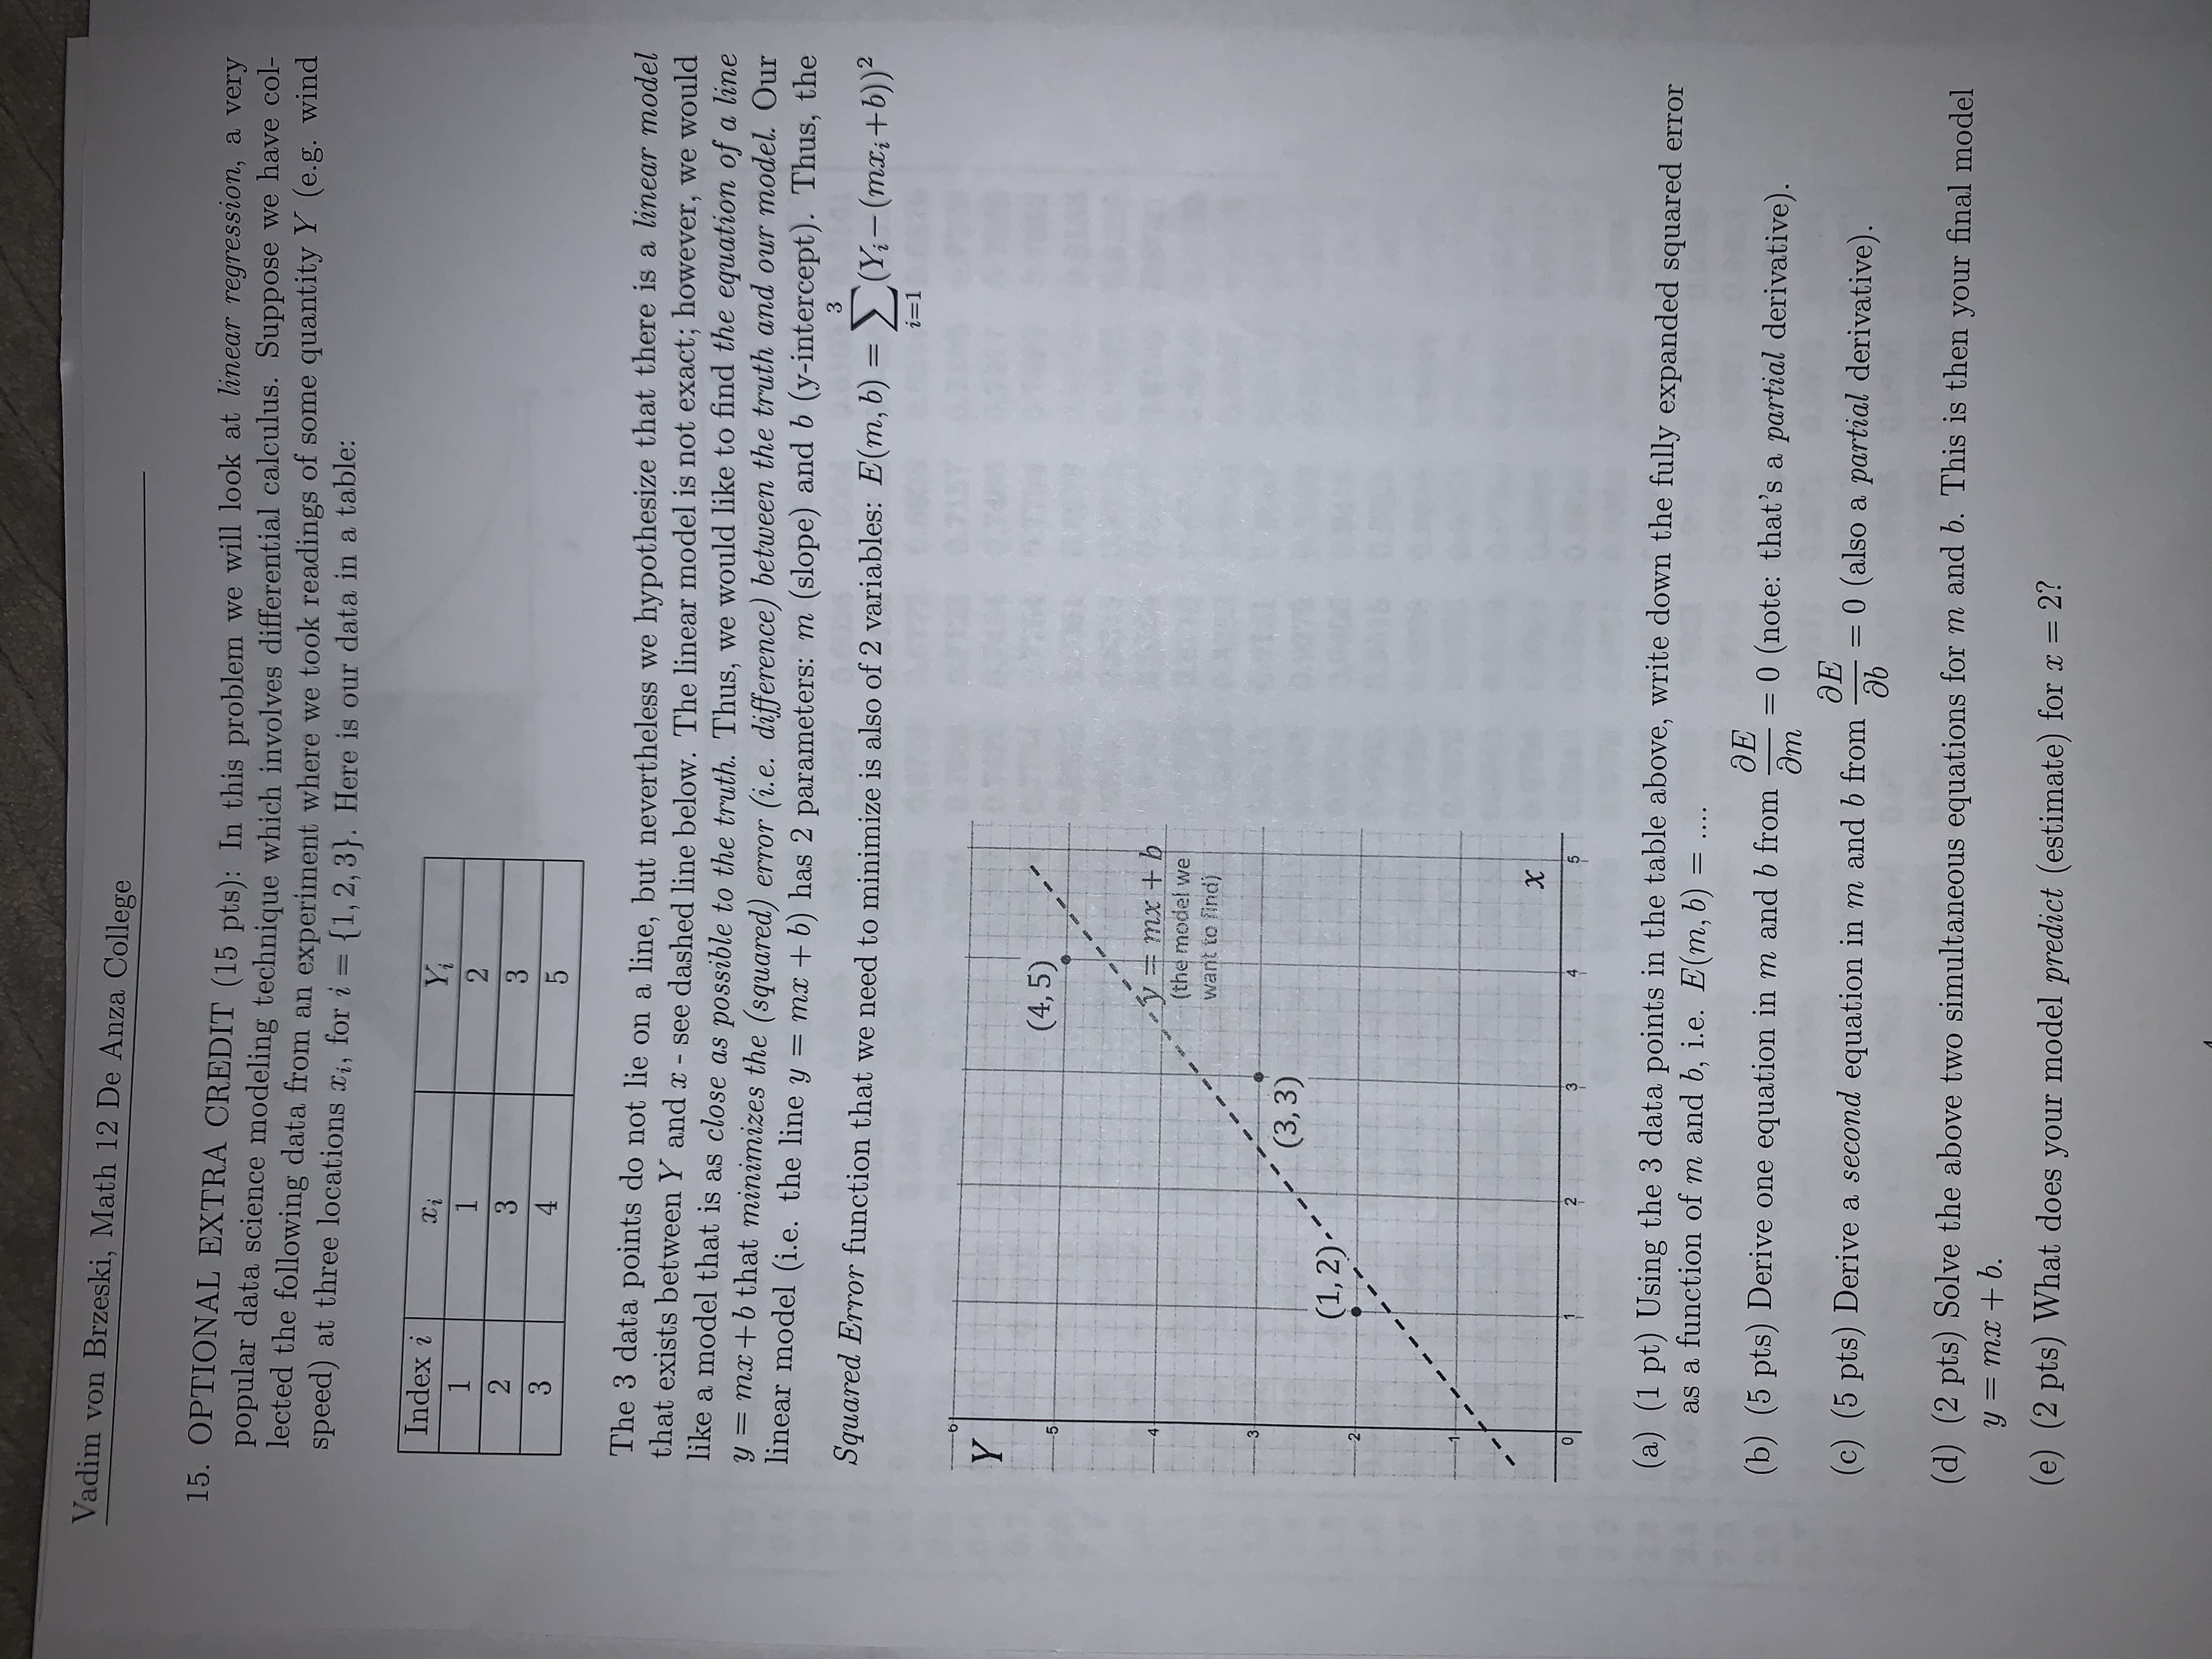
Vadim von Brzeski, Math 12 De Anza College 15. OPTIONAL EXTRA CREDIT (15 pts): In this problem we will look at linear regression, a very popular data science modeling technique which involves differential calculus. Suppose we have col- lected the following data from an experiment where we took readings of some quantity Y (e.g. wind speed) at three locations Xi, for i = {1, 2, 3}. Here is our data in a table: Index i 4 The 3 data points do not lie on a line, but nevertheless we hypothesize that there is a linear model that exists between Y and x - see dashed line below. The linear model is not exact; however, we would like a model that is as close as possible to the truth. Thus, we would like to find the equation of a line y = mx +b that minimizes the (squared) error (i.e. difference) between the truth and our model. Our linear model (i.e. the line y = mx + b) has 2 parameters: m (slope) and b (y-intercept). Thus, the Squared Error function that we need to minimize is also of 2 variables: E(m, b) = Z(Yi-(mxitb))2 i= 1 ( 4, 5) ymx +b (the model we want to find) (3, 3) (1, 2).- X (a) (1 pt) Using the 3 data points in the table above, write down the fully expanded squared error as a function of m and b, i.e. E(m, b) = .... (b) (5 pts) Derive one equation in m and b from OE am =0 (note: that's a partial derivative). (c) (5 pts) Derive a second equation in m and b from OE ab =0 (also a partial derivative). (d) (2 pts) Solve the above two simultaneous equations for m and b. This is then your final model y = mx + b. (e) (2 pts) What does your model predict (estimate) for x = 2
Step by Step Solution
There are 3 Steps involved in it

Get step-by-step solutions from verified subject matter experts