

Question: Please answer the following question in detail. Please show working and explanation where needed. Please. 1. The following data give real GDP, Y, capital, K,
Please answer the following question in detail. Please show working and explanation where needed. Please.
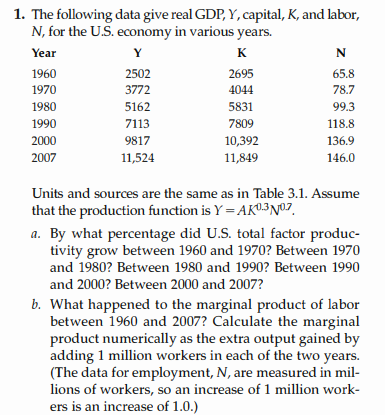
1. The following data give real GDP, Y, capital, K, and labor, N, for the U.S. economy in various years. Year Y K N 1960 2502 2695 65.8 1970 3772 4044 78.7 1980 5162 5831 99.3 1990 7113 7809 118.8 2000 9817 10,392 136.9 2007 11,524 11,849 146.0 Units and sources are the same as in Table 3.1. Assume that the production function is Y = AK03N07. n. By what percentage did U.S. total factor produc- tivity grow between 1960 and 1970? Between 1970 and 1980? Between 1980 and 1990? Between 1990 and 2000? Between 2000 and 2007? b. What happened to the marginal product of labor between 1960 and 2007? Calculate the marginal product numerically as the extra output gained by adding 1 million workers in each of the two years. (The data for employment, N, are measured in mil- lions of workers, so an increase of 1 million work- ers is an increase of 1.0.)
Step by Step Solution
There are 3 Steps involved in it

Get step-by-step solutions from verified subject matter experts