

Question: Please answer the following question using STAT Question 1: The Organic Effect This Exercise pertains to a 2015 study' which took a Swedish family that

Please answer the following question using STAT
Question 1:


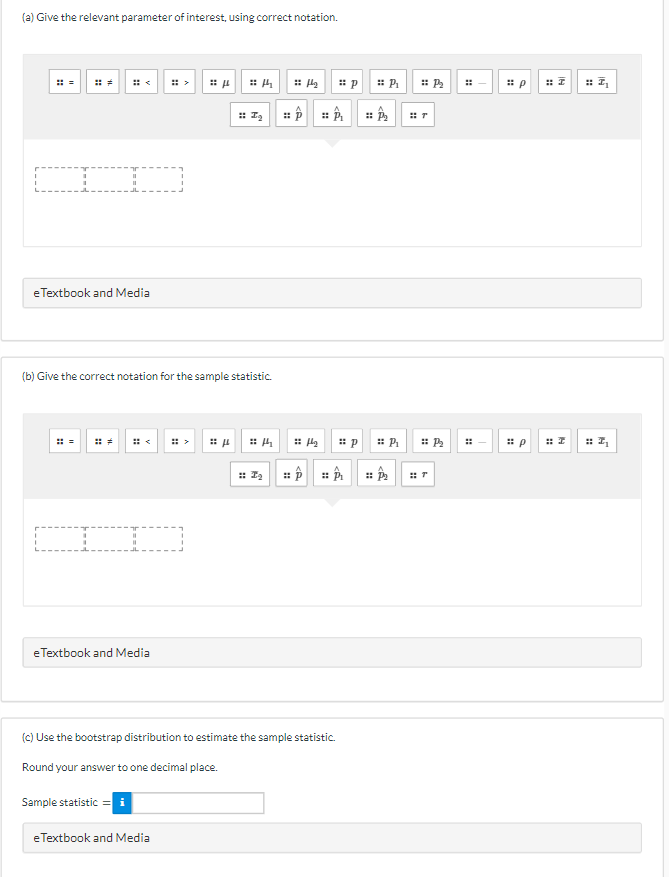


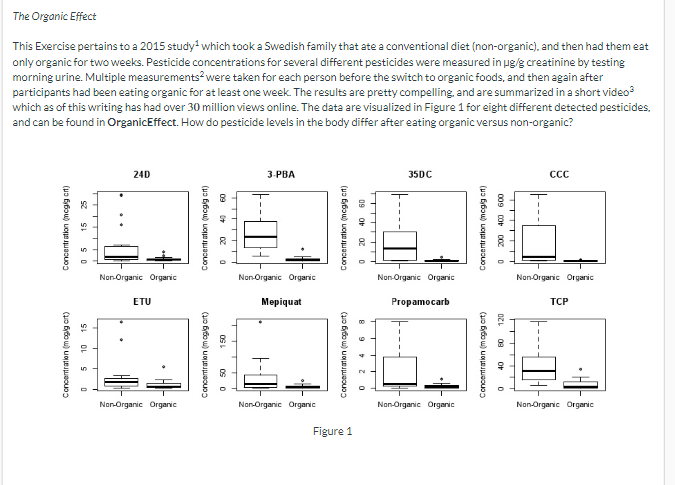
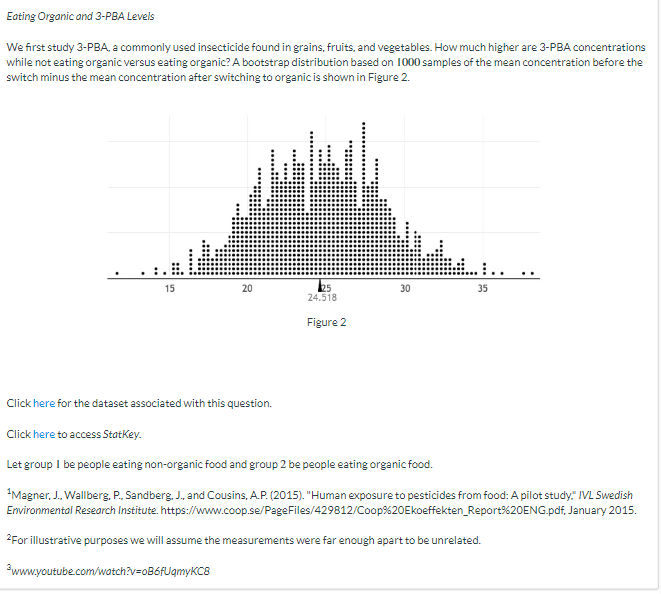
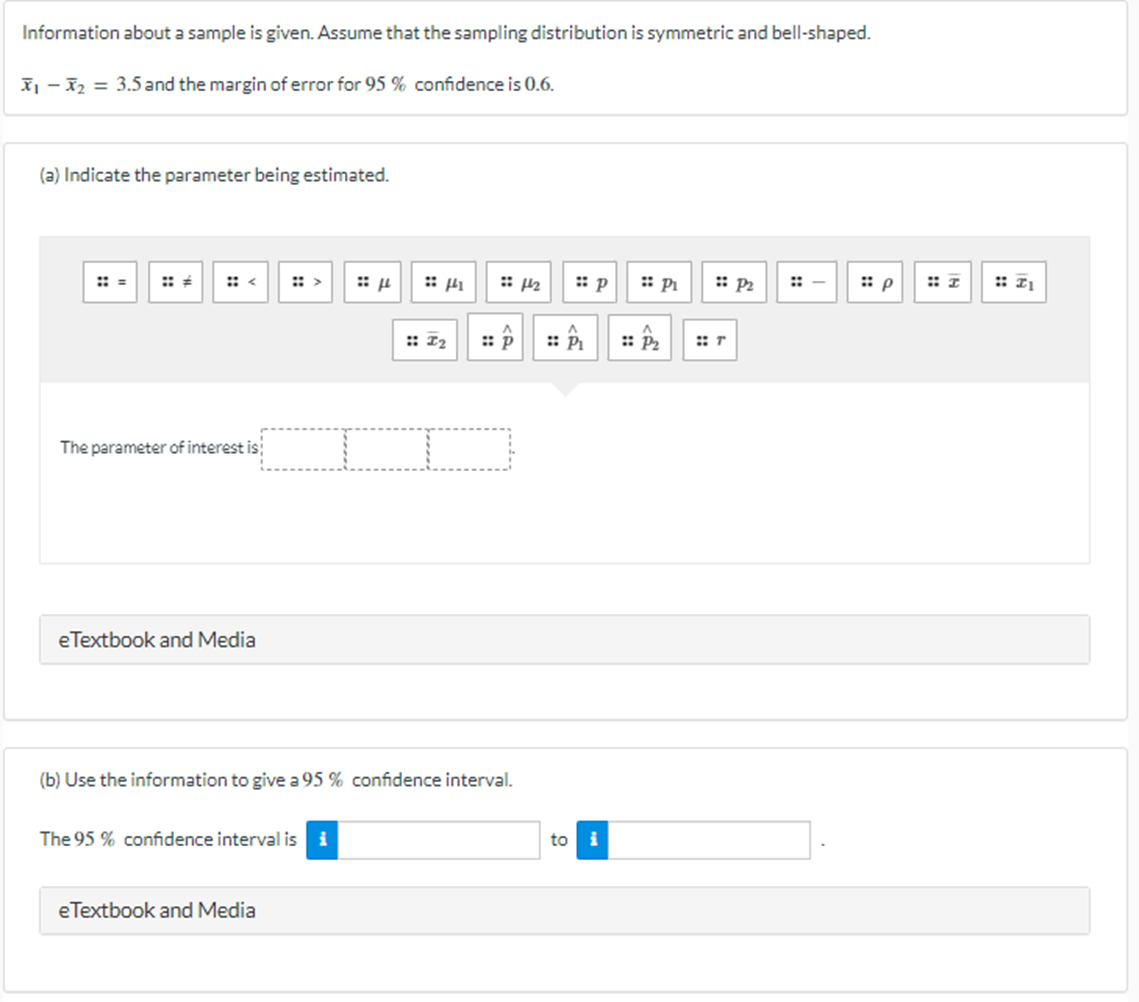
The Organic Effect This Exercise pertains to a 2015 study' which took a Swedish family that ate a conventional diet (non-organic), and then had them eat only organic for two weeks. Pesticide concentrations for several different pesticides were measured in ug/g creatinine by testing morning urine. Multiple measurements* were taken for each person before the switch to organic foods, and then again after participants had been eating organic for at least one week. The results are pretty compelling, and are summarized in a short video which as of this writing has had over 30 million views online. The date are visualized in Figure 1 for eight different detected pesticides, and can be found in OrganicEffect. How do pesticide levels in the body differ after eating organic versus non-organic? 240 3-PBA 35DC CCC 200 400 600 Concentration (negg cr) 15 Concentration (neglig cr) Concentration (negg er) Concentration (ncgg cr) 5 Non-Organic Organic Non-Organic Organic Non-Organic Organic Non Organic Organic ETU Mepiquat Propamocarb TCP 120 15 10 Concentration (mogg art) Concentration (mogg art) Concentration (mogg ort) Concentration (mogg ort) 50 Non-Organic Organic Non-Organic Organic Non-Organic Organic Non-Organic Organic Figure 1Eating Organic and 3-PBA Levels We first study 3-PBA, a commonly used insecticide found in grains, fruits, and vegetables. How much higher are 3-PBA concentrations while not eating organic versus eating organic? A bootstrap distribution based on 1000 samples of the mean concentration before the switch minus the mean concentration after switching to organic is shown in Figure 2. i . . . . 15 20 25 30 35 24.518 Figure 2 Click here for the dataset associated with this question. Click here to access StatKey. Let group I be people eating non-organic food and group 2 be people eating organic food. "Magner, J.. Wallberg, P. Sandberg, J., and Cousins, A.P. (2015). "Human exposure to pesticides from food: A pilot study." IVL Swedish Environmental Research Institute. https://www.coop.se/PageFiles/429812/Coop*%20Ekoeffekten_Report$20ENG.pdf, January 2015. "For illustrative purposes we will assume the measurements were far enough apart to be unrelated. www.youtube.com/watch?v=oBofUqmyKC8(a) Give the relevant parameter of interest, using correct notation. :: P2 : p e Textbook and Media [b) Give the correct notation for the sample statistic. :: /2 : P :: P : T e Textbook and Media (c) Use the bootstrap distribution to estimate the sample statistic. Round your answer to one decimal place. Sample statistic = i e Textbook and Media(d) Use the bootstrap distribution to estimate a 99% confidence interval. Round your answers to the nearest integer. The interval is i we/g crt to i ug/g crt. e Textbook and Media (e) Interpret this interval in context. O We are 99% confident that the people in the sample had 3-PBA concentrations between 15 and 35 units higher when eating non-organic than when eating organic. O Between 15% and 35%% of people have higher concentrations of 3-PBA when eating non-organic then when eating organic O We are confident that 99% of people have 3-PBA concentrations between 15 and 35 units higher when eating non- organic than when eating organic. O We are 99% confident that the people in the sample had mean 3-PBA concentrations between 15 and 35 units higher when eating non-organic than when eating organic O We are 99% confident that all people will have mean 3-PBA concentrations between 15 and 35 units higher when eating non-organic than when eating organic. e Textbook and Media (f) Does this interval provide evidence that concentrations of the pesticide 3-PBA are lower while eating organic? V k and Media(f) Does this interval provide evidence that concentrations of the pesticide 3-PBA are lower while eating organic? e Textbook and Media (g) Can we conclude that eating organic couses lower concentrations of 3-PBA? No k and MediaInformation about a sample is given. Assume that the sampling distribution is symmetric and bell-shaped. X1 - X2 = 3.5 and the margin of error for 95 % confidence is 0.6. (a) Indicate the parameter being estimated. #: #1 : P :: PI .: P2 :: 12 : p : P : P The parameter of interest is; eTextbook and Media (b) Use the information to give a 95 % confidence interval. The 95 % confidence interval is to i e Textbook and Media
Step by Step Solution
There are 3 Steps involved in it

Get step-by-step solutions from verified subject matter experts