

Question: Please answer the following questions below based on the photo. Please show your work and include explanations. Try to keep it simple as well, sometimes
Please answer the following questions below based on the photo. Please show your work and include explanations. Try to keep it simple as well, sometimes terminology can confuse me because I have trouble understanding these.Questions-1. What are the two variables in this study? What type of variable is each?2. Create a scatter plot of these data.3. Describe your impression of the relation between these variables based on the scatter plot.4. Compute the Pearson correlation coefficient for these data.5. Summarize the findings using cohens guidelines.6. Perform remain steps if hypothesis testing.7. What limitations are there to the conclusions you can draw based on this correlation.8. Use the a-b-c model to explain possible causes for the relation between these variables. Thanks
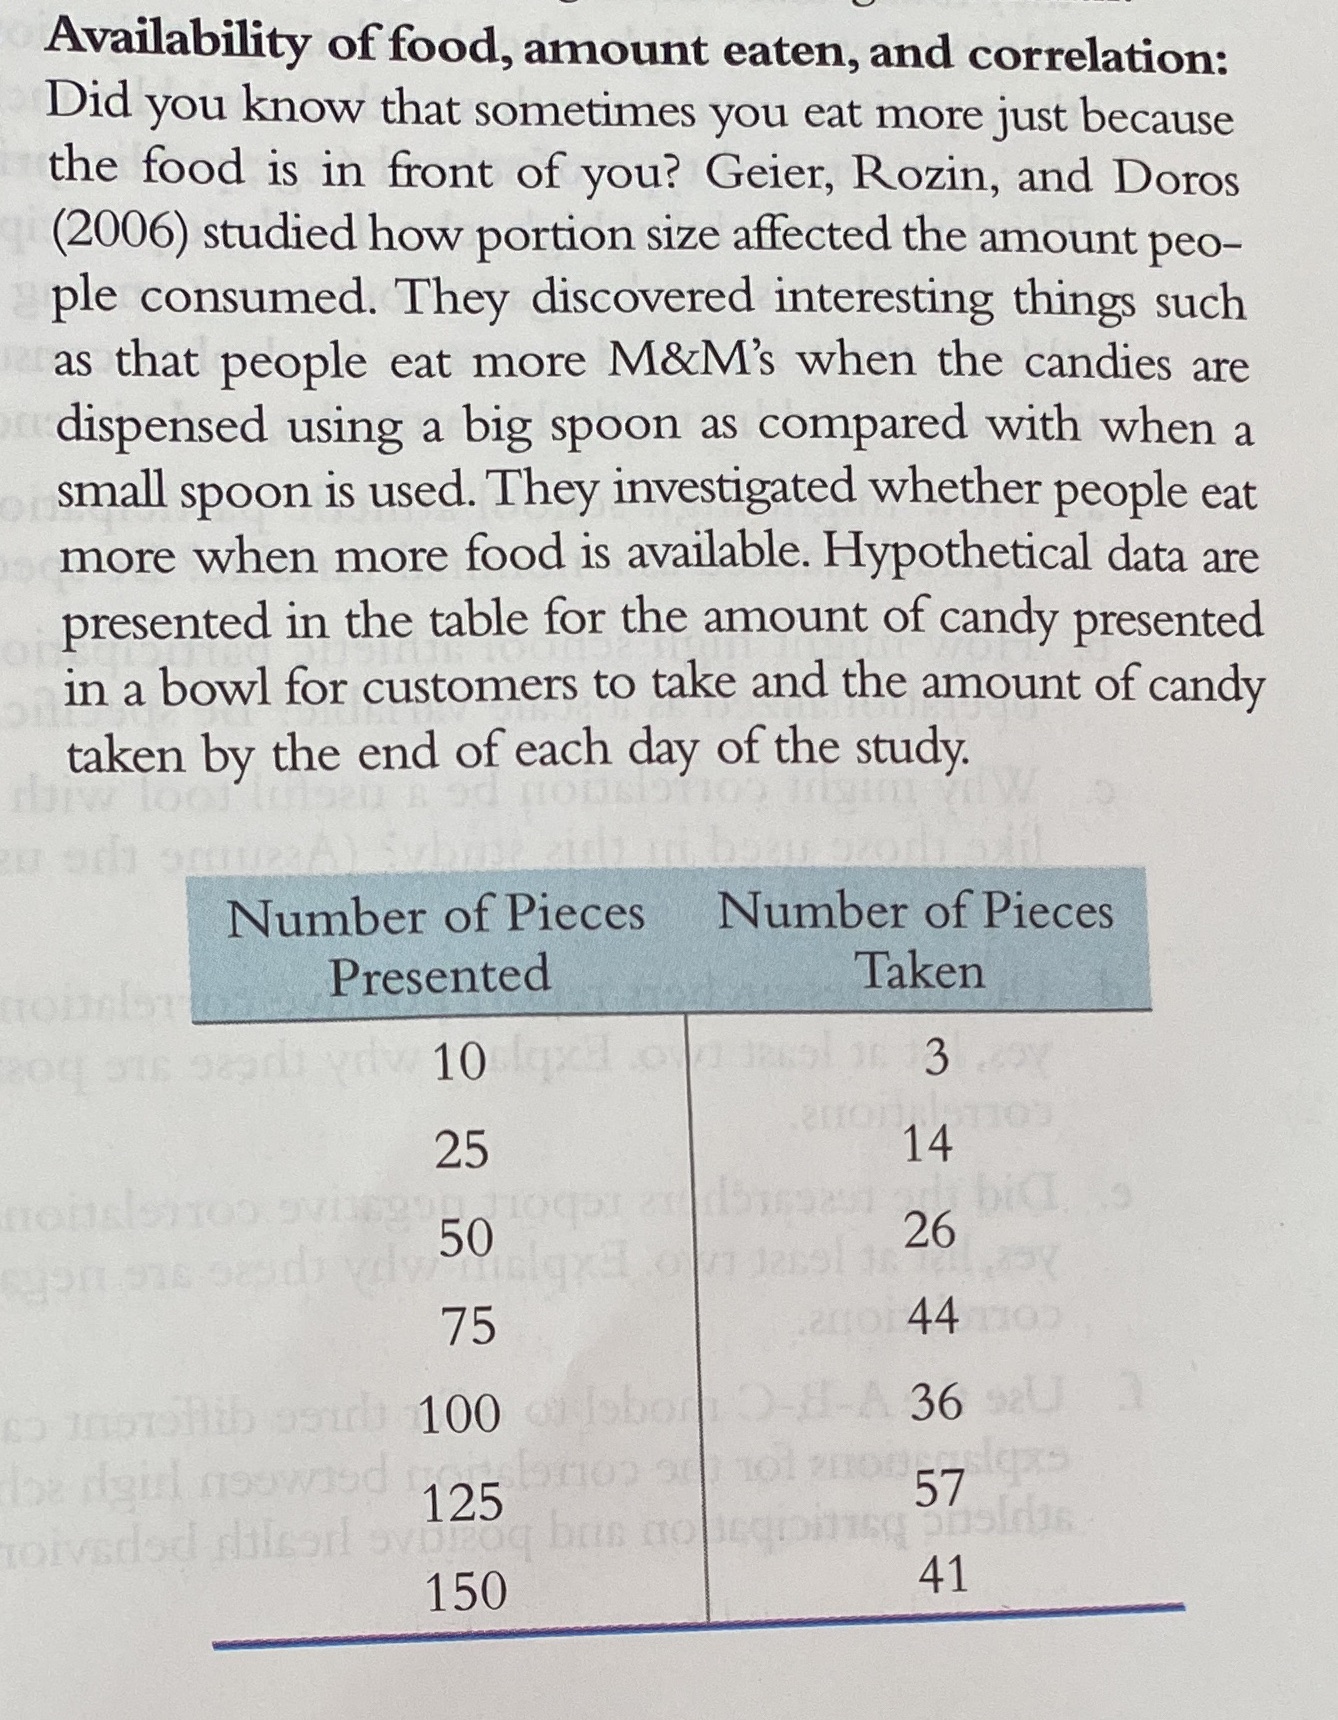
U Availability of food, amount eaten, and correlation: Did you know that sometimes you eat more just because the food is in front of you? Geier, Rozin, and Doros (2006) studied how portion size affected the amount peo ple consumed. They discovered interesting things such as that people eat more M&M's when the candies are dispensed using a big spoon as compared with when a small spoon is used. They investigated whether people eat more when more food is available. Hypothetical data are presented in the table for the amount of candy presented in a bowl for customers to take and the amount of candy taken by the end of each day of the study
Step by Step Solution
There are 3 Steps involved in it

Get step-by-step solutions from verified subject matter experts