

Question: Please answer the highlight question. P2-49. Comparing Operating Characteristics Across Industries Review the following selected income statement and balance sheet data for fiscal years ending
Please answer the highlight question.
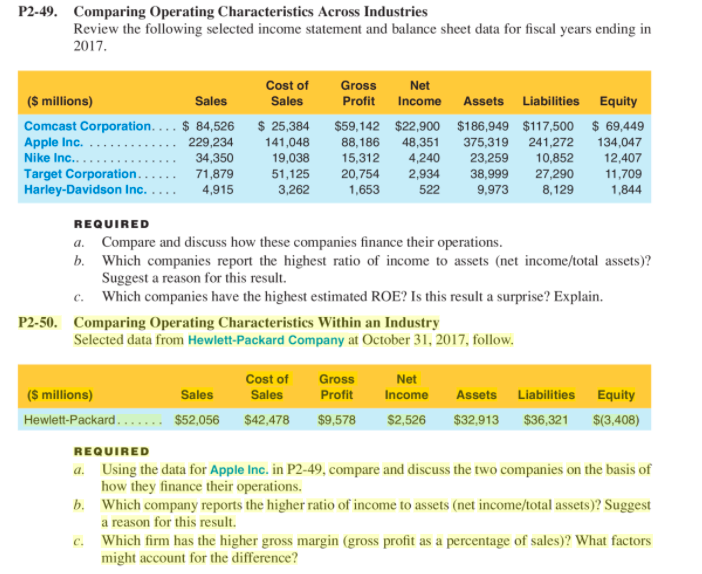
P2-49. Comparing Operating Characteristics Across Industries Review the following selected income statement and balance sheet data for fiscal years ending in 2017. (5 millions) Sales Comcast Corporation.... $ 84,526 Apple Inc. 229,234 Nike Inc.. .. 34,350 Target Corporation.... 71,879 Harley-Davidson Inc. 4,915 Cost of Sales $ 25,384 141,048 19,038 51,125 3,262 Gross Net Profit Income Assets Liabilities Equity $59,142 $22,900 $186,949 $117,500 $ 69,449 88,186 48,351 375,319 241,272 134,047 15,312 4,240 23,259 10,852 12,407 20,754 2,934 38,999 27,290 11,709 1,653 522 9,973 8,129 1,844 REQUIRED a. Compare and discuss how these companies finance their operations. b. Which companies report the highest ratio of income to assets (net income/total assets)? Suggest a reason for this result. c. Which companies have the highest estimated ROE? Is this result a surprise? Explain. P2-50. Comparing Operating Characteristics Within an Industry Selected data from Hewlett-Packard Company at October 31, 2017, follow. Cost of Gross Net (5 millions) Sales Sales Profit Income Assets Liabilities Equity Hewlett-Packard... $52,056 $42,478 $9,578 $2,526 $32,913 $36,321 $(3,408) REQUIRED a. Using the data for Apple Inc. in P2-49, compare and discuss the two companies on the basis of how they finance their operations. b. Which company reports the higher ratio of income to assets (net income/total assets)? Suggest a reason for this result. Which firm has the higher gross margin (gross profit as a percentage of sales)? What factors might account for the difference? c
Step by Step Solution
There are 3 Steps involved in it

Get step-by-step solutions from verified subject matter experts