

Question: Please answer. THE OXFORD HOME BUILDER CASE DS OxHome Part I The trend in home building in recent years has been to emphasize open spaces
Please answer.
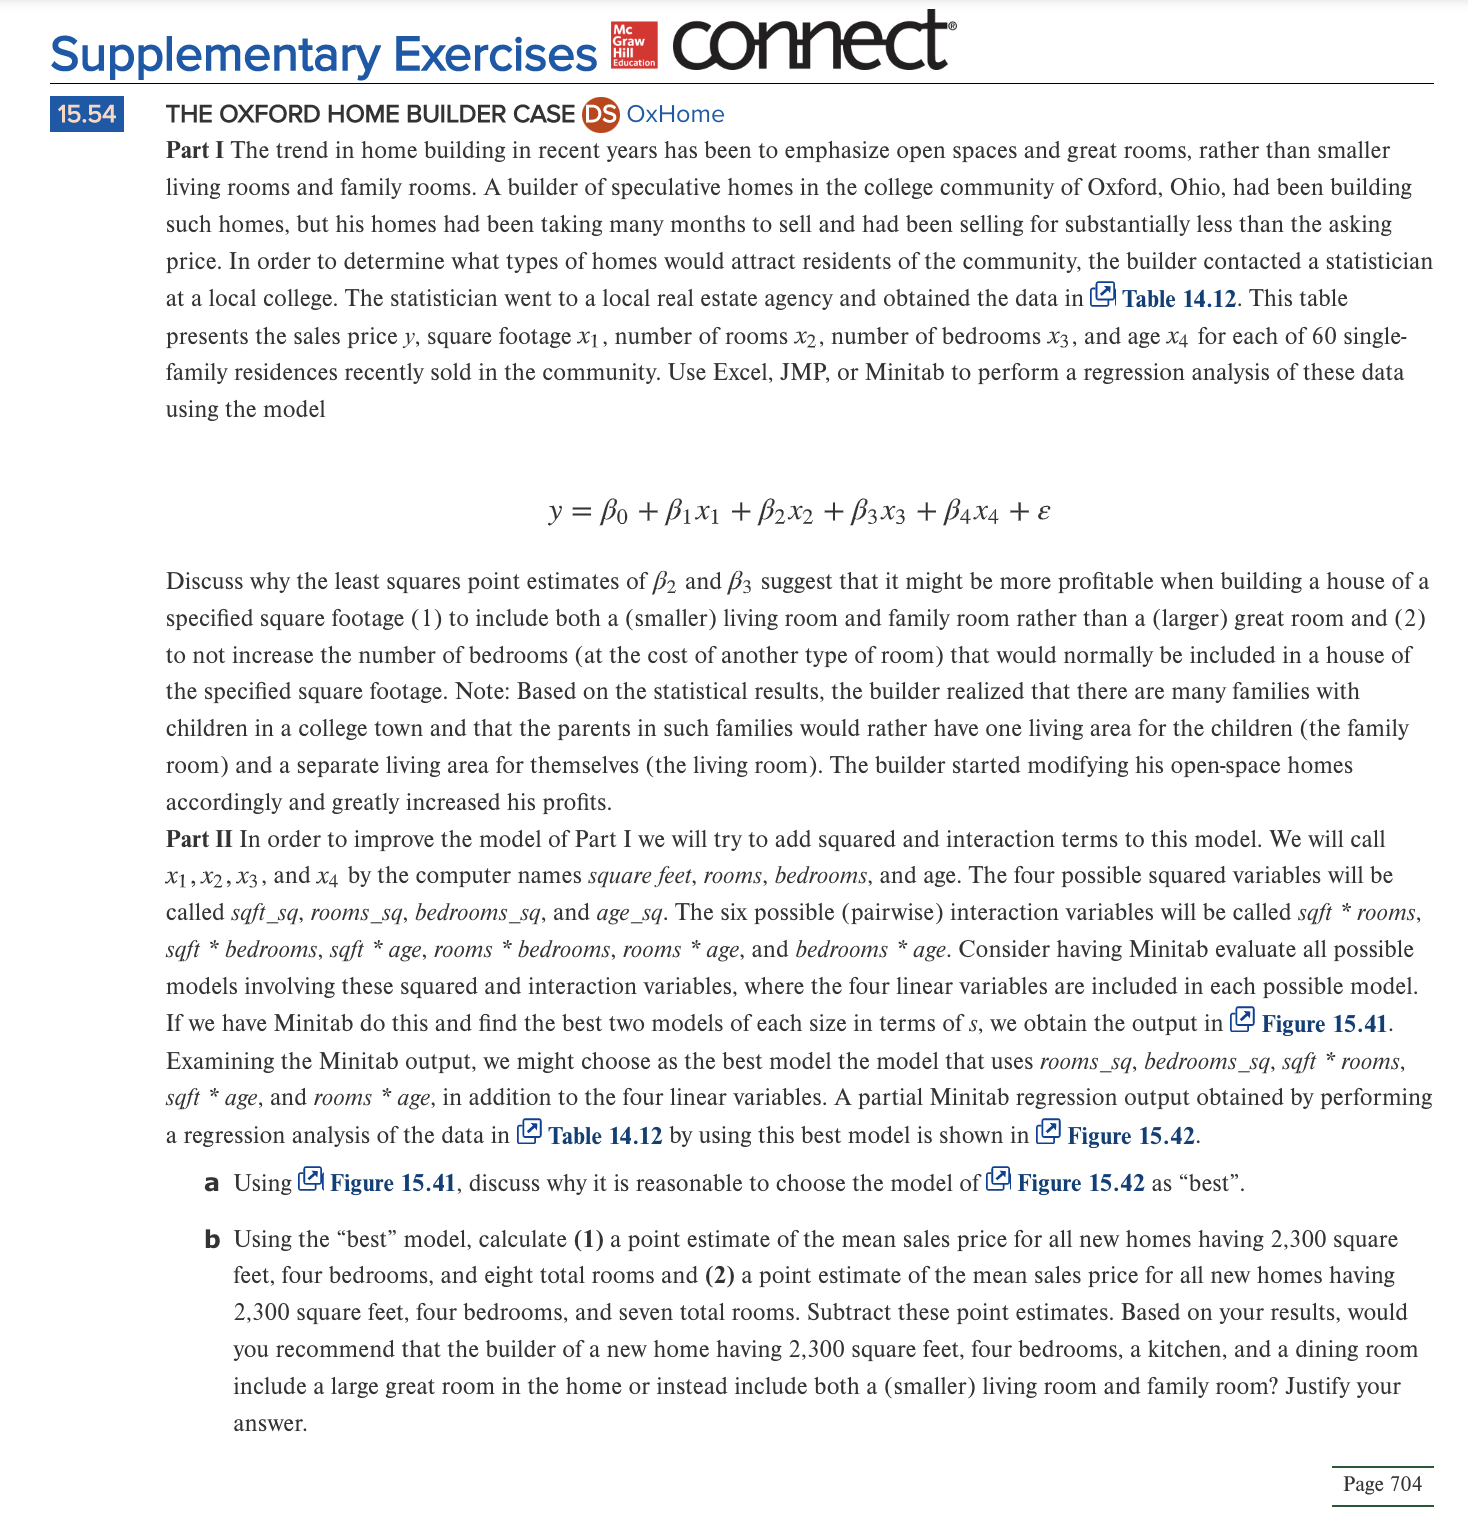
THE OXFORD HOME BUILDER CASE DS OxHome Part I The trend in home building in recent years has been to emphasize open spaces and great rooms, rather than smaller living rooms and family rooms. A builder of speculative homes in the college community of Oxford, Ohio, had been building such homes, but his homes had been taking many months to sell and had been selling for substantially less than the asking price. In order to determine what types of homes would attract residents of the community, the builder contacted a statistician presents the sales price y, square footage x1, number of rooms x2, number of bedrooms x3, and age x4 for each of 60 singlefamily residences recently sold in the community. Use Excel, JMP, or Minitab to perform a regression analysis of these data using the model y=0+1x1+2x2+3x3+4x4+ Discuss why the least squares point estimates of 2 and 3 suggest that it might be more profitable when building a house of a specified square footage (1) to include both a (smaller) living room and family room rather than a (larger) great room and (2) to not increase the number of bedrooms (at the cost of another type of room) that would normally be included in a house of the specified square footage. Note: Based on the statistical results, the builder realized that there are many families with children in a college town and that the parents in such families would rather have one living area for the children (the family room) and a separate living area for themselves (the living room). The builder started modifying his open-space homes accordingly and greatly increased his profits. Part II In order to improve the model of Part I we will try to add squared and interaction terms to this model. We will call x1,x2,x3, and x4 by the computer names square feet, rooms, bedrooms, and age. The four possible squared variables will be called sqft_sq,rooms_sq, bedrooms_sq, and age_sq. The six possible (pairwise) interaction variables will be called sqft *rooms, sqft * bedrooms, sqft * age, rooms * bedrooms, rooms * age, and bedrooms * age. Consider having Minitab evaluate all possible models involving these squared and interaction variables, where the four linear variables are included in each possible model. If we have Minitab do this and find the best two models of each size in terms of s, we obtain the output in Figure 15.41. Examining the Minitab output, we might choose as the best model the model that uses rooms_sq,bedrooms_sq,sqft * rooms, sqft * age, and rooms * age, in addition to the four linear variables. A partial Minitab regression output obtained by performing a regression analysis of the data in Table 14.12 by using this best model is shown in Figure 15.42. b Using the "best" model, calculate (1) a point estimate of the mean sales price for all new homes having 2,300 square feet, four bedrooms, and eight total rooms and (2) a point estimate of the mean sales price for all new homes having 2,300 square feet, four bedrooms, and seven total rooms. Subtract these point estimates. Based on your results, would you recommend that the builder of a new home having 2,300 square feet, four bedrooms, a kitchen, and a dining room include a large great room in the home or instead include both a (smaller) living room and family room? Justify your
Step by Step Solution
There are 3 Steps involved in it

Get step-by-step solutions from verified subject matter experts