

Question: Please answer the question 5. The following table gives a summary count of the health status of people and the results of a screening. Test
Please answer the question
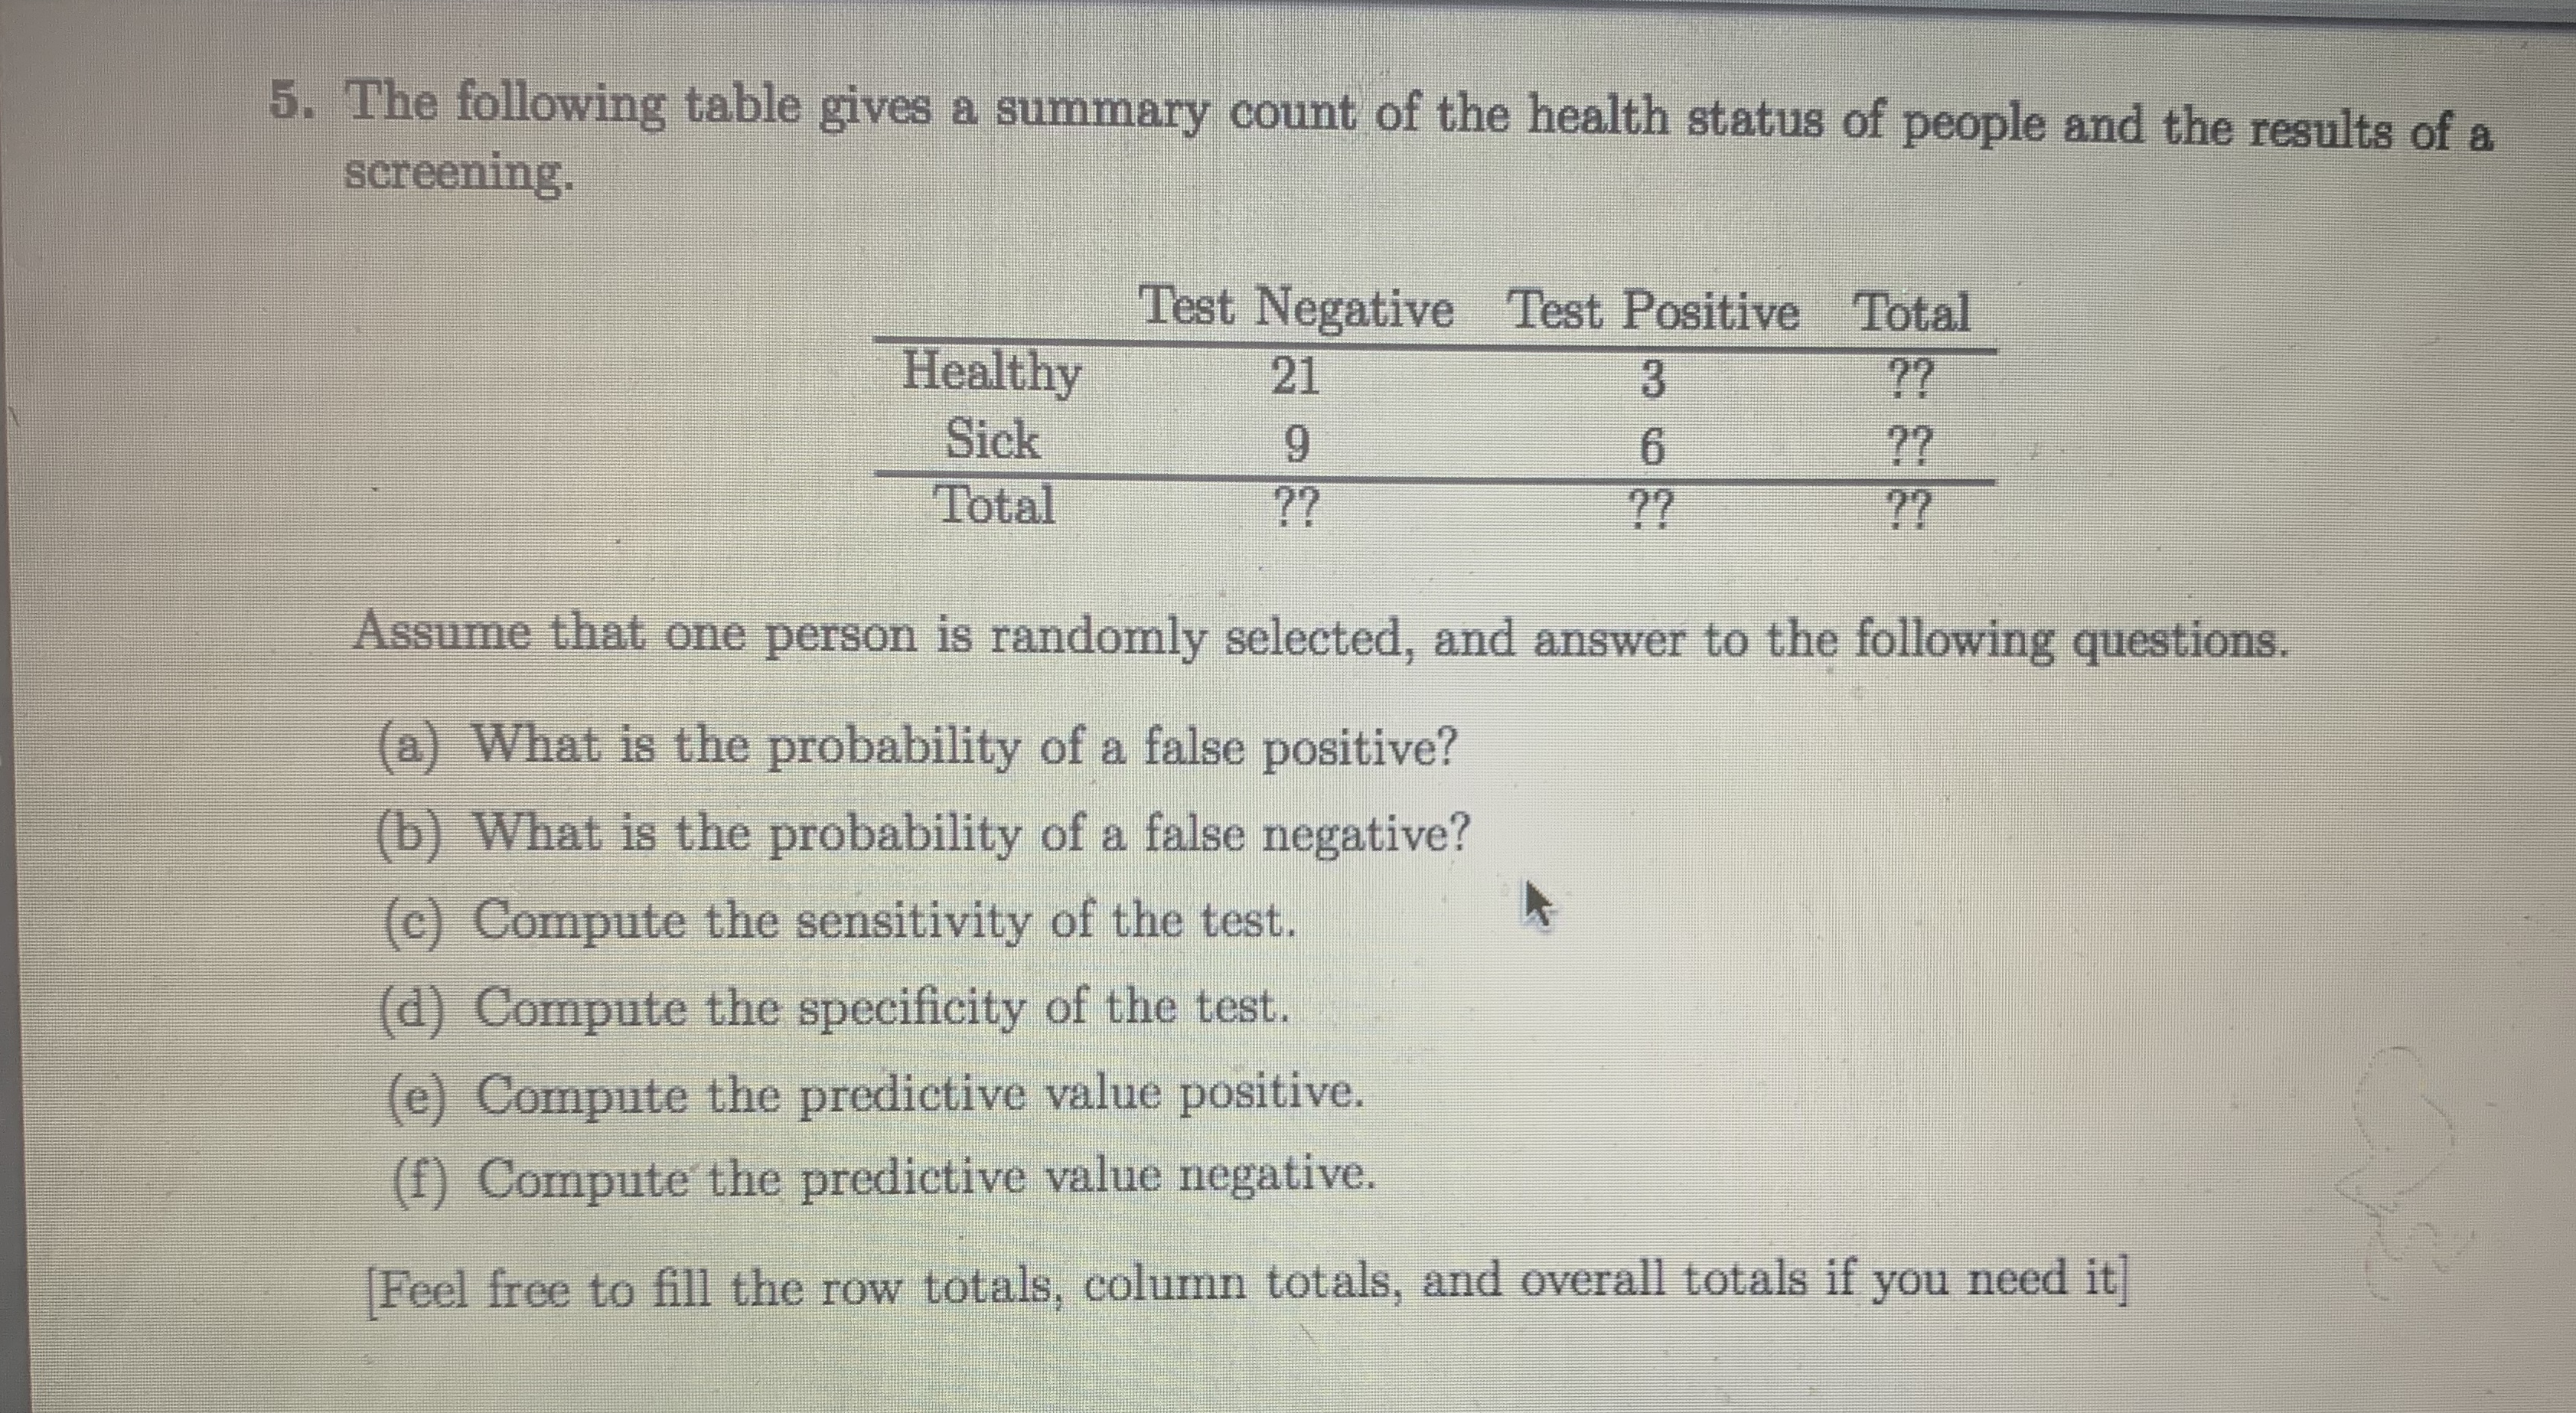
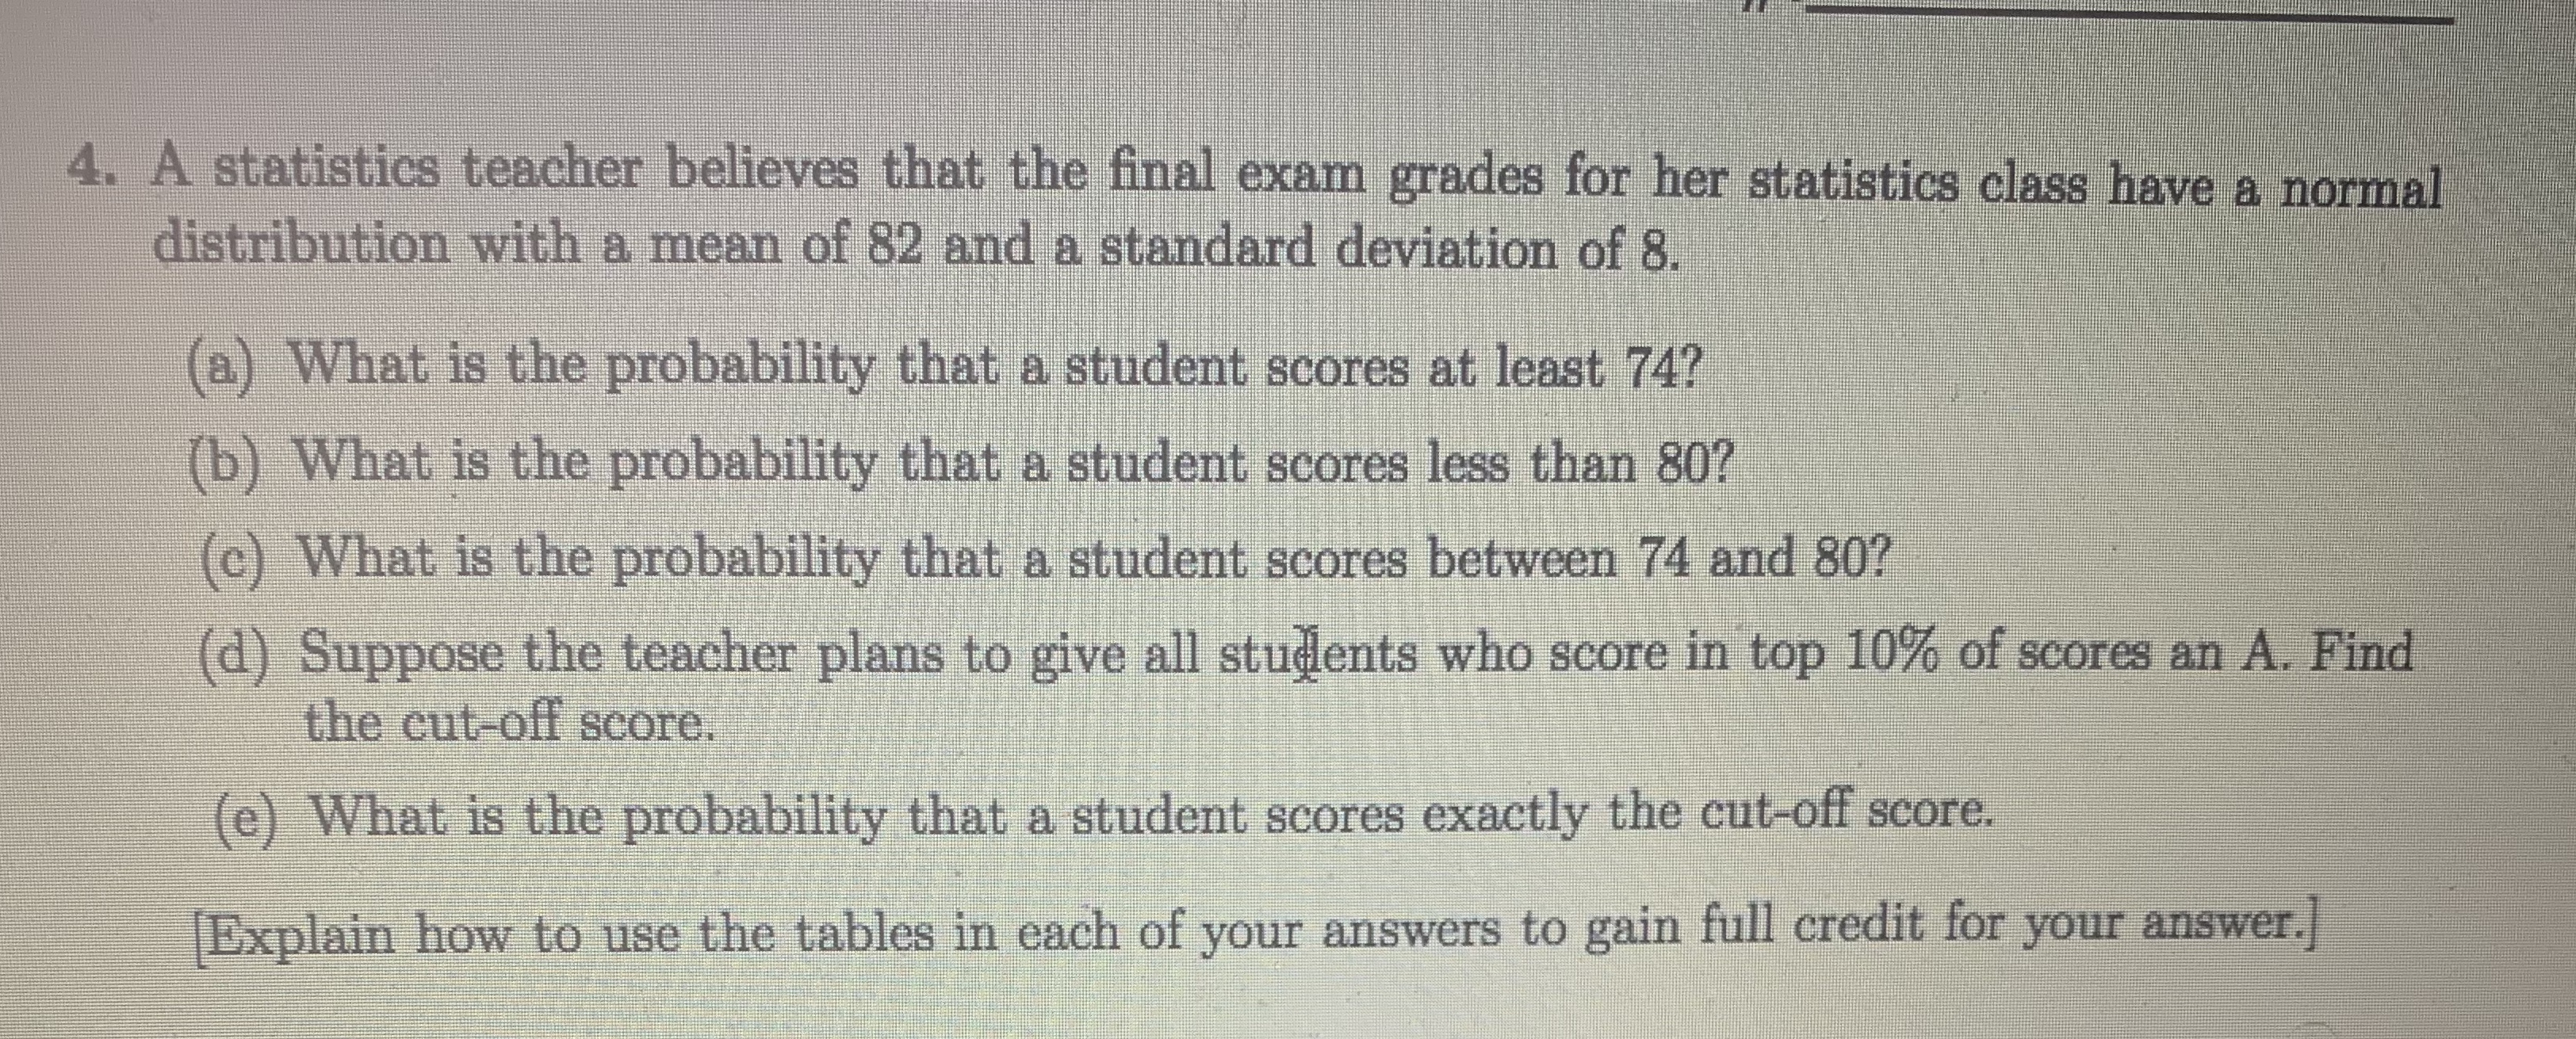
5. The following table gives a summary count of the health status of people and the results of a screening. Test Negative Test Positive Total Healthy 21 ? ? Sick 9 6 ?? Total ?? ?? ?? Assume that one person is randomly selected, and answer to the following questions. (a) What is the probability of a false positive? (b) What is the probability of a false negative? (c) Compute the sensitivity of the test. (d) Compute the specificity of the test. (e) Compute the predictive value positive. (f) Compute the predictive value negative. [Feel free to fill the row totals, column totals, and overall totals if you need it]4. A statistics teacher believes that the final exam grades for her statistics class have a normal distribution with a mean of 82 and a standard deviation of 8. (a) What is the probability that a student scores at least 74? (b) What is the probability that a student scores less than 80? (c) What is the probability that a student scores between 74 and 80? (d) Suppose the teacher plans to give all students who score in top 10% of scores an A. Find the cut-off score. (e) What is the probability that a student scores exactly the cut-off score. Explain how to use the tables in each of your answers to gain full credit for your answer.]
Step by Step Solution
There are 3 Steps involved in it

Get step-by-step solutions from verified subject matter experts