

Question: Please answer the question based on pic i have attached. Obtain the ACF and partial autocorrelation graphs of the differenced data to determine the appropriate

Please answer the question based on pic i have attached.
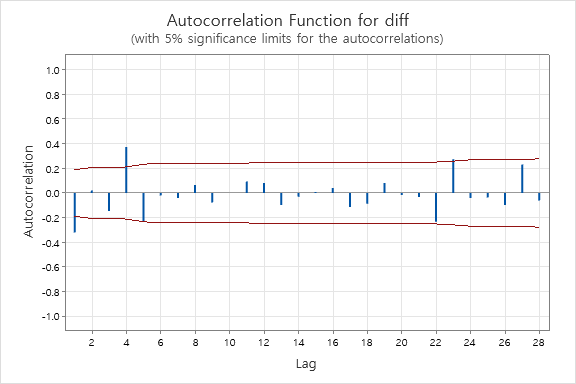
Obtain the ACF and partial autocorrelation graphs of the differenced data to determine the appropriate ARIMA model.

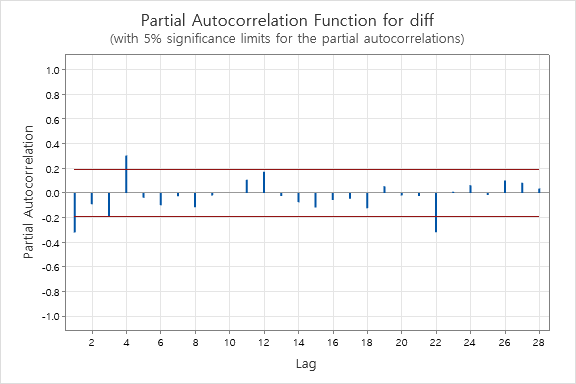
Autocorrelation Function for diff (with 5% significance limits for the autocorrelations) 1.0 0.8 0.6 0.4 0.2 Autocorrelation 0.0 -0.2 -0.4 -0.6 -0.8 -1.0 2 6 8 10 12 14 16 18 20 22 24 26 28 LagPartial Autocorrelation Function for diff (with 5% significance limits for the partial autocorrelations) 1.0 0.8 0.6 0.4 0.2 Partial Autocorrelation 0.0 T -0.2 -0.4 -0.6 -0.8 -1.0 6 8 10 12 14 16 18 20 22 24 26 28 2 Lag
Step by Step Solution
There are 3 Steps involved in it
1 Expert Approved Answer
Step: 1 Unlock

Question Has Been Solved by an Expert!
Get step-by-step solutions from verified subject matter experts
Step: 2 Unlock
Step: 3 Unlock