

Question: Please answer the question number six in the 3-4 attachments: analyzing the graphs and all of the data given, and in red that I am
Please answer the question number six in the 3-4 attachments: analyzing the graphs and all of the data given, and in red that I am put into the grade chart at the end, when comparing the BodPod method of body percent fat estimation to the other four methods studied, which two methods have the strongest association with the BodPod and which one has the weakest association with the BodPod and why? Use The correlation coefficient, coefficient of determination, slope, intercept, 95% confidence intervals, and all the data in red, and in the chart in gray at the end to explain which two methods of body percent fat estimation are the most in agreement with the BodPod, and which method is the least in agreement with the bodpod in their percent body fat estimations. There is no other reference material needed or given and this image is the best I have so please if you can't make out the numbers in red they are more legible in the grade chart at the end, so read them there. Also, I have edited this question adding two separate images of the two pages as well as a picture of part of my original question, which is basically the same as what is posted here and in question number six. Thanks
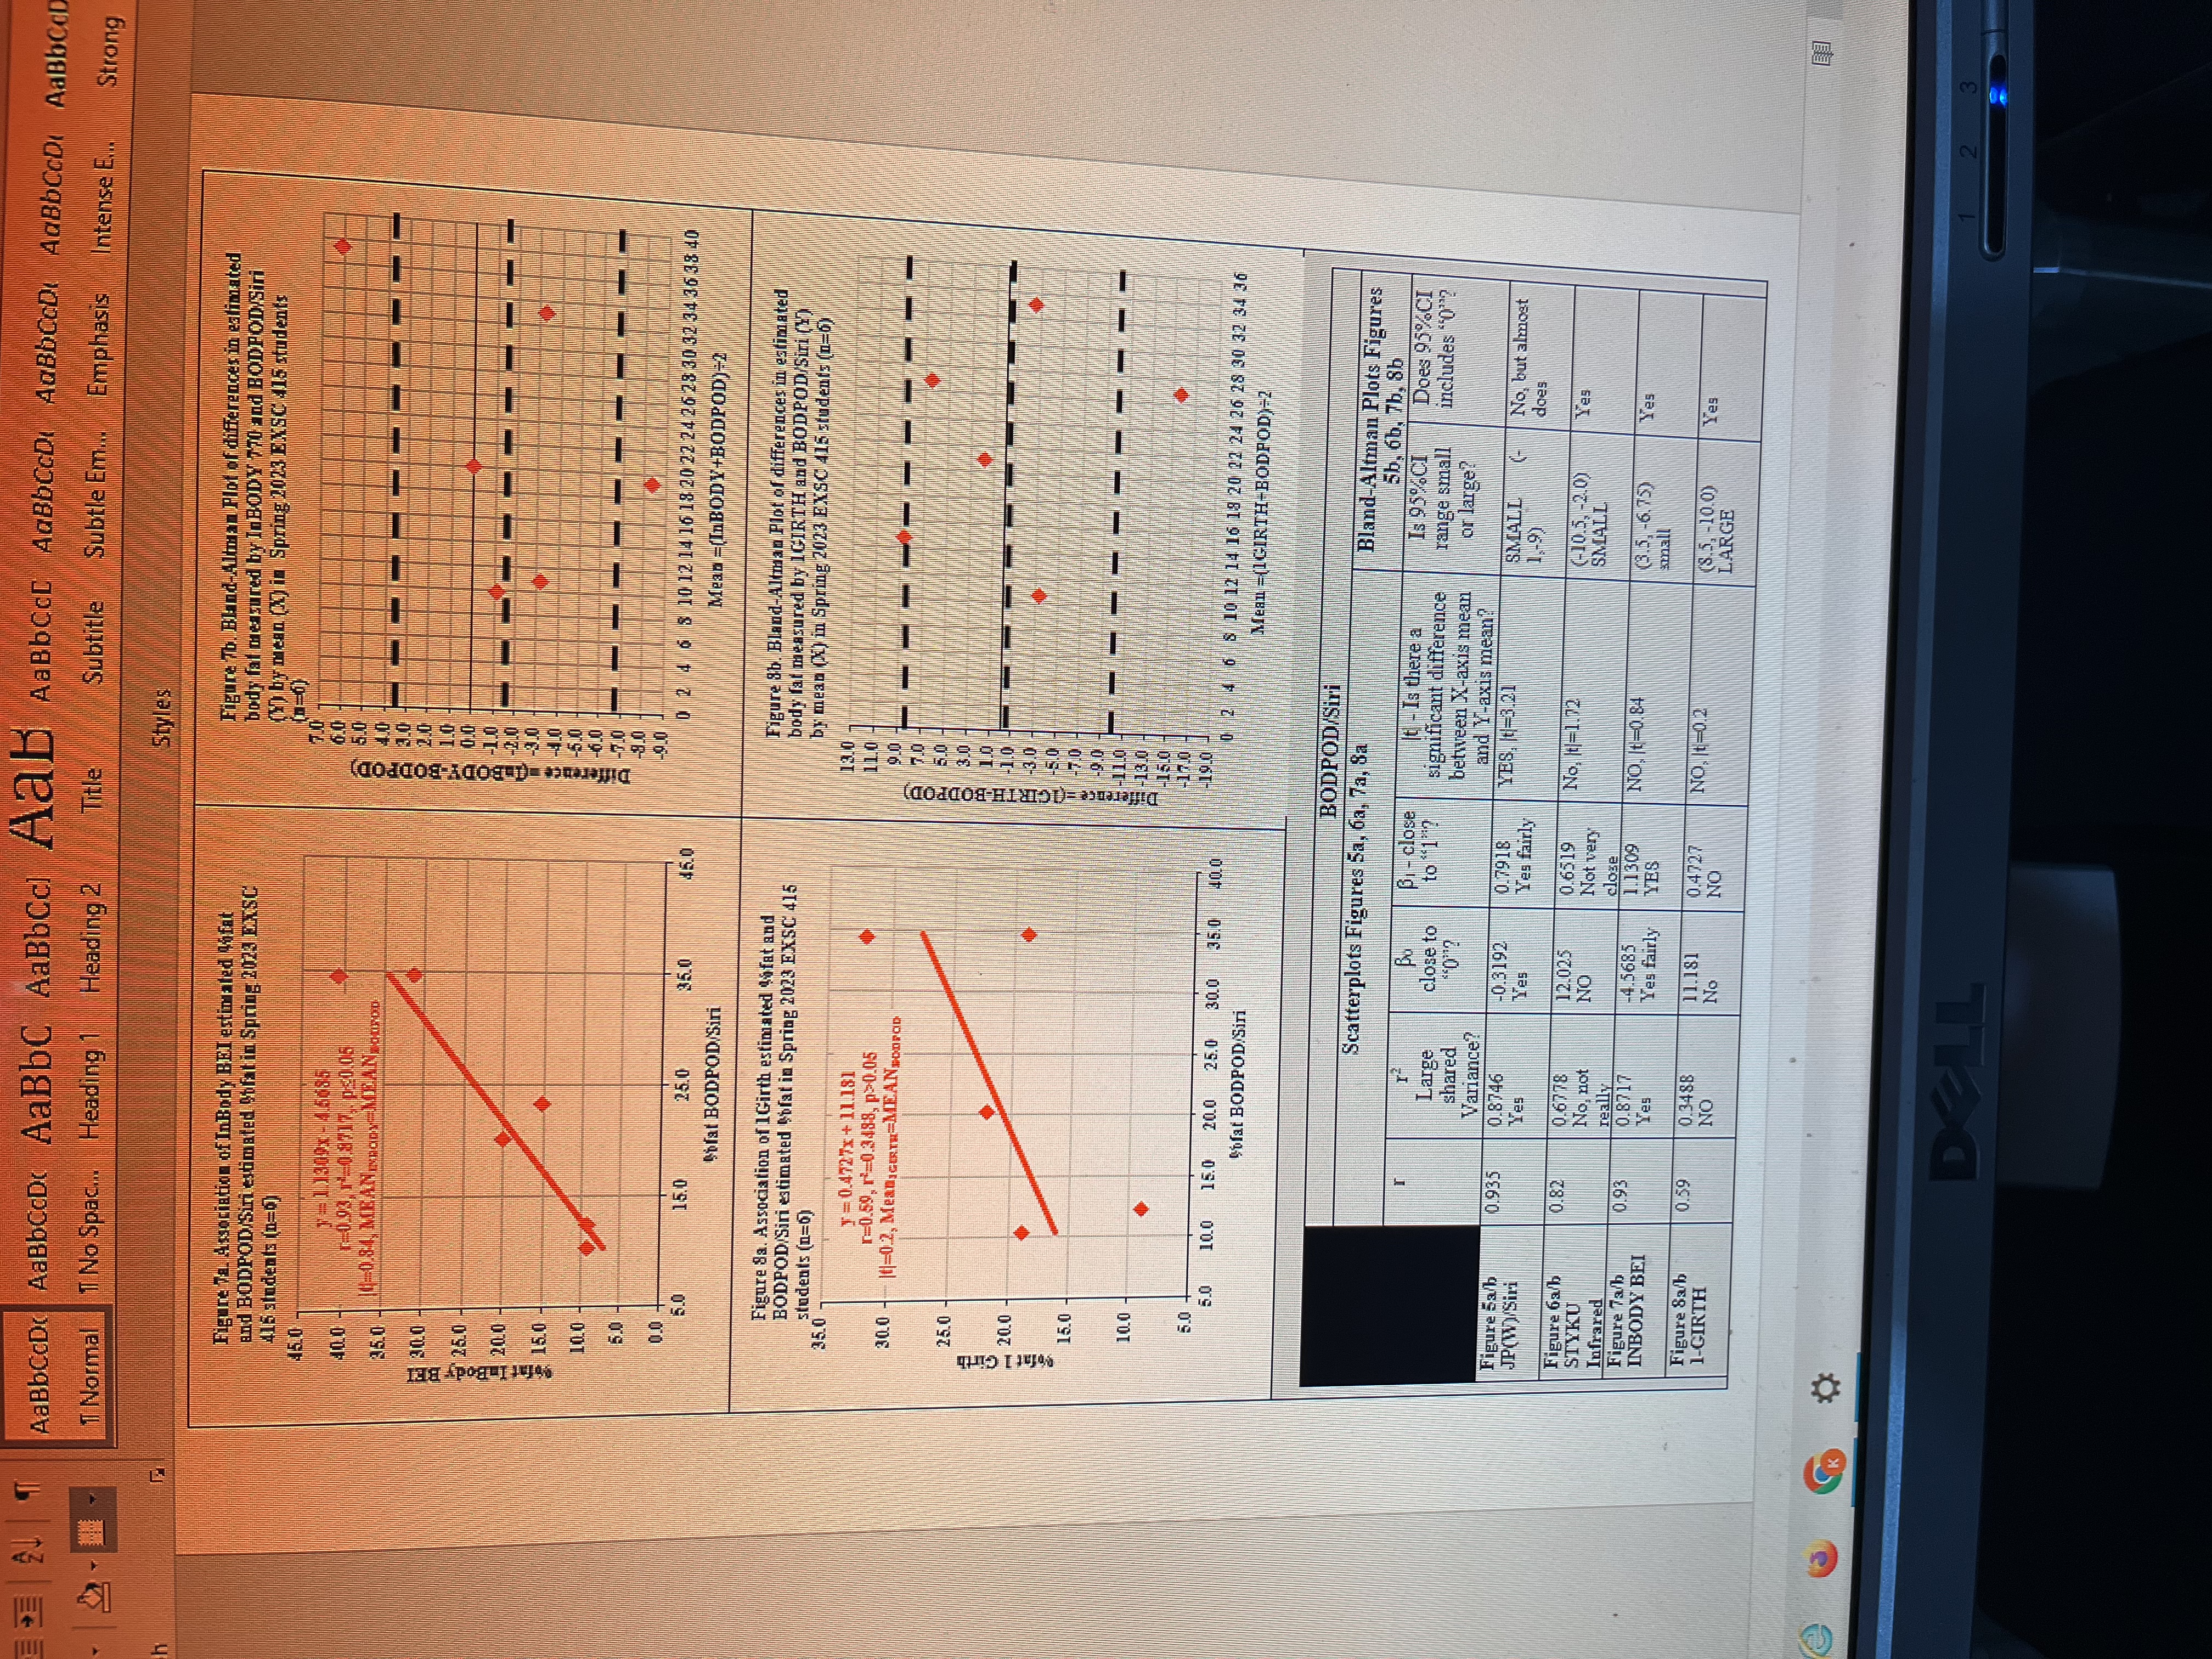
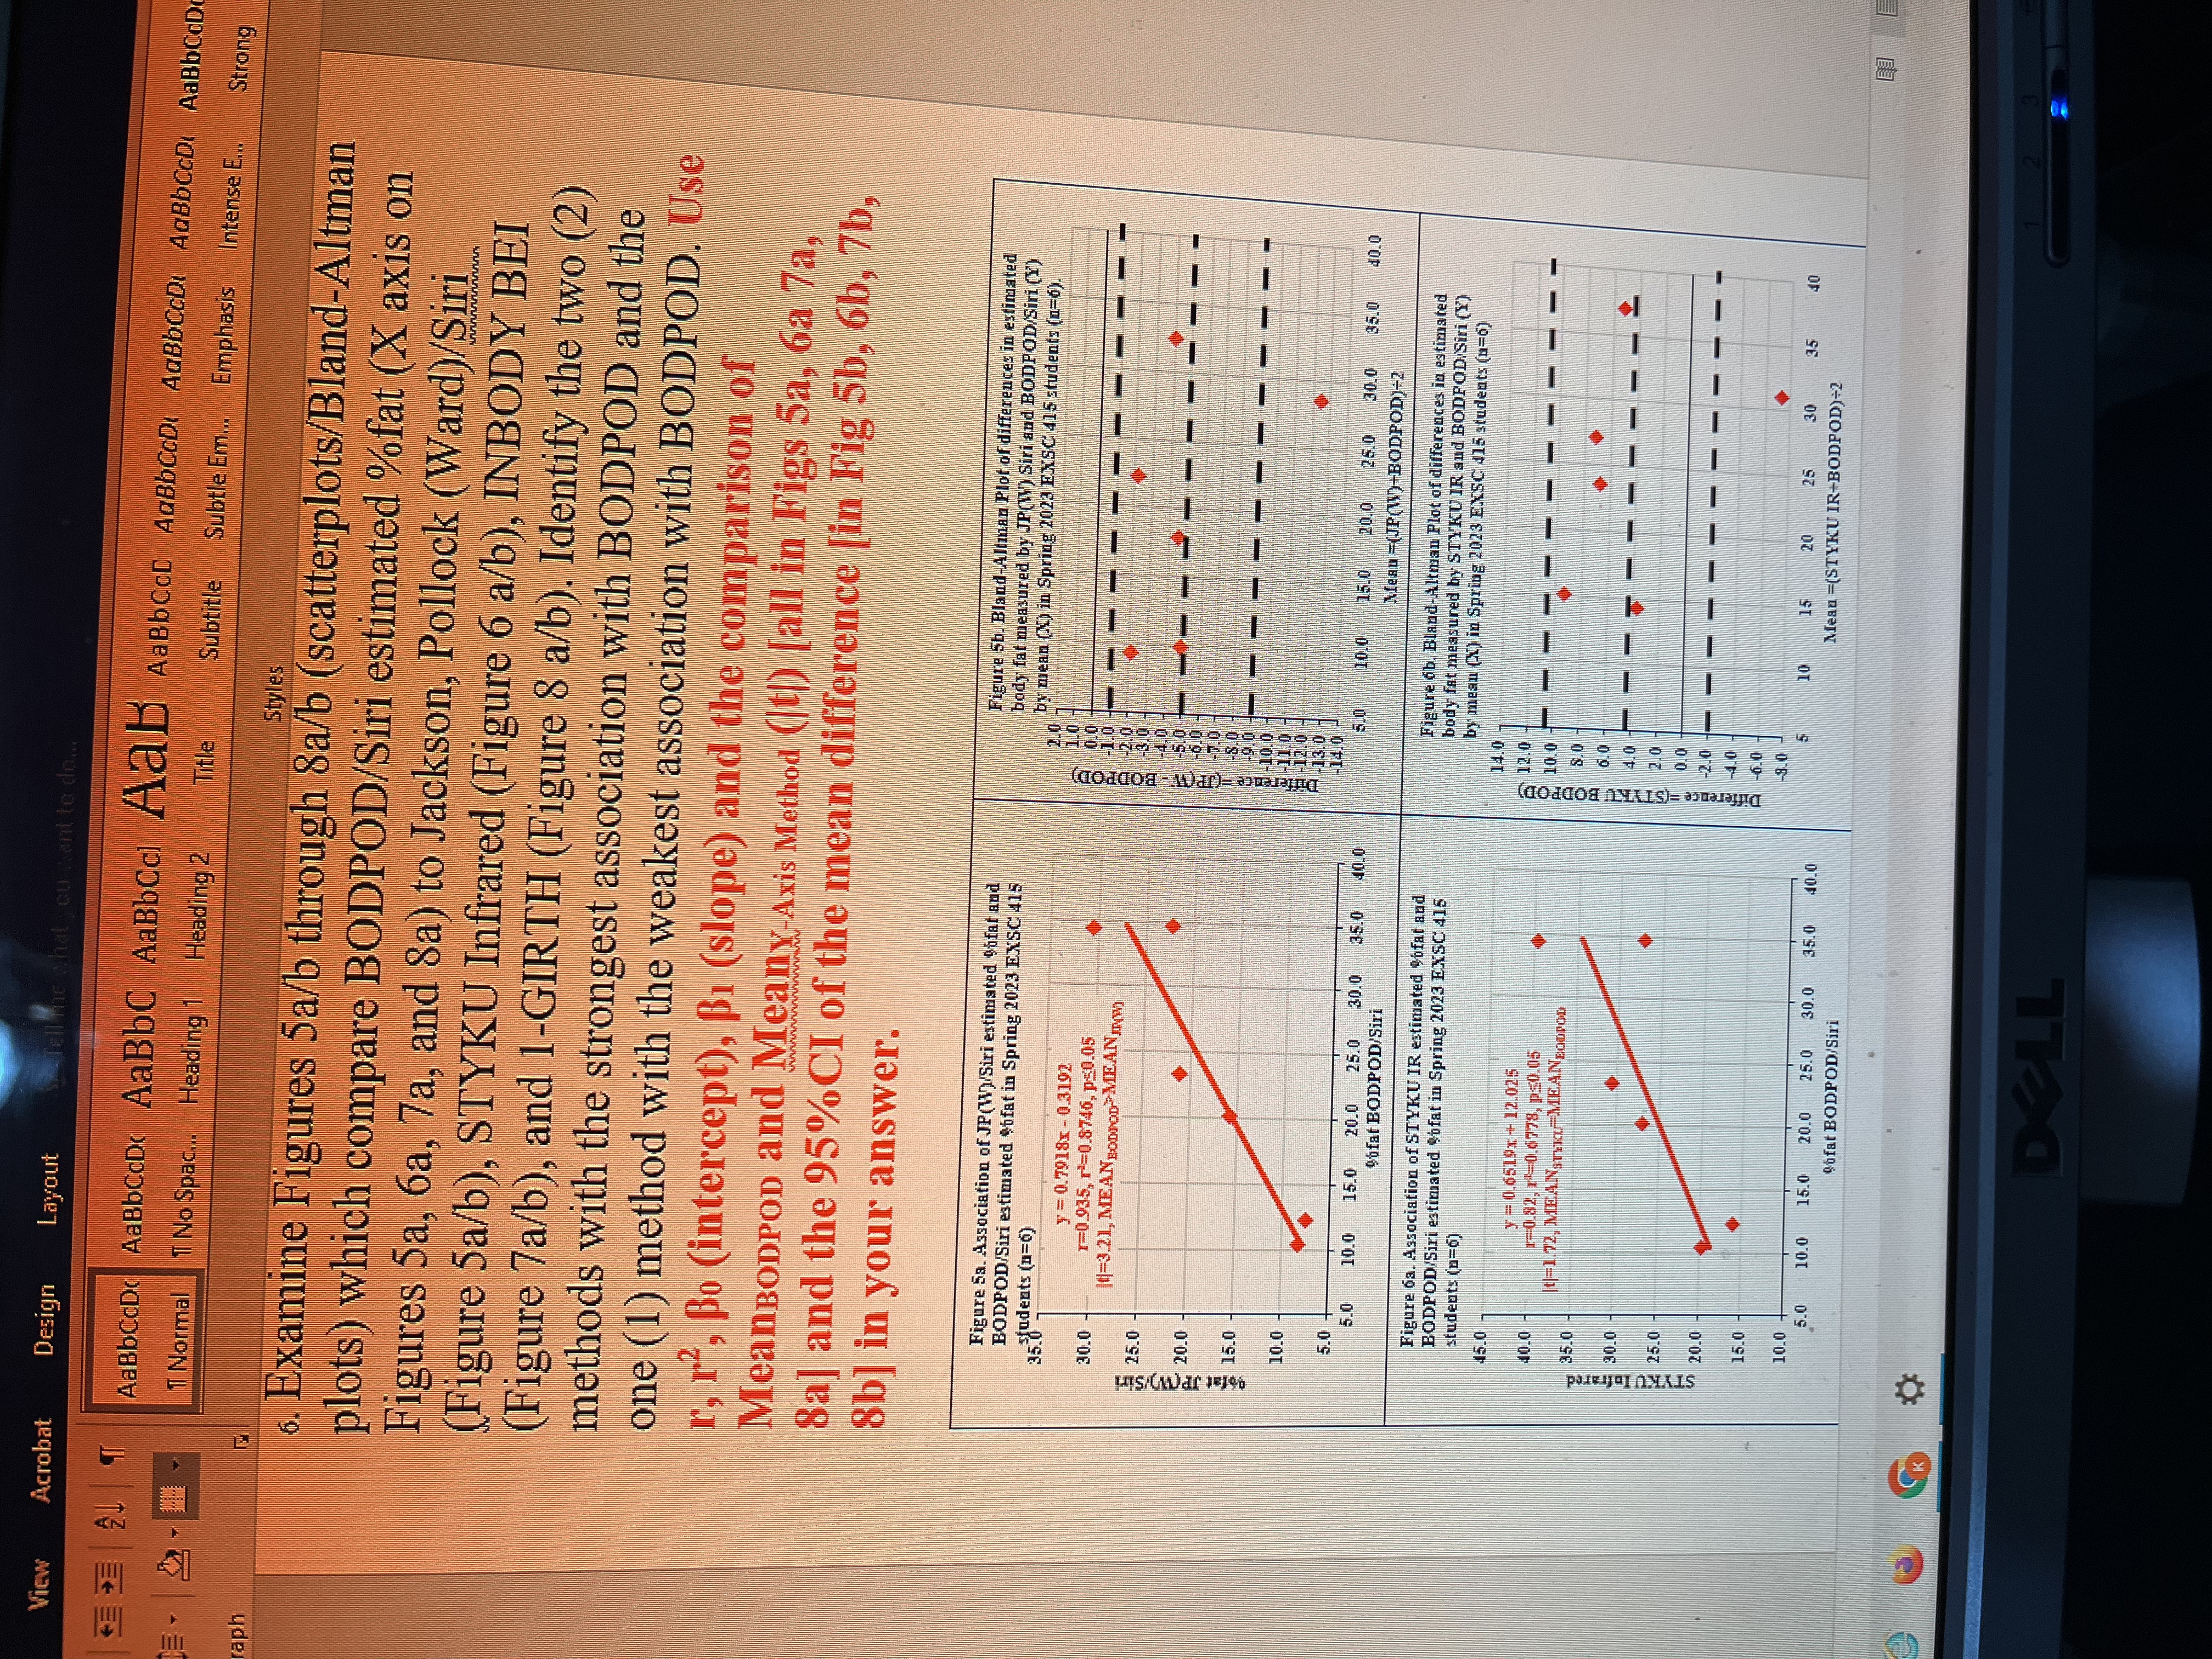
AaBbCCDd AsBbCCD( AaBbC AaBbca Aab AaBbCCD AaBbCCD( AaBbCCD( AGBbCCD AaBbCCD 1 Normal 1 No Spac.. Heading 1 Heading 2 Title Subtitle Subtle Em.. Emphasis Intense E.. Strong Styles Figure Ta. Association of InBody BEI estimated ofat Figure To. Bland-Altman Plot of differences in estimated and BODPOD/Siri estimated Sofat in Spring 2023 ExSC body fat measured by 1-BODY 770 and BODPOD siri 415 students (n=0] (Nby mean (X) in Spring 2023 EXSC 415 students 150 - 1 1309x - 45085 6.0 510 300 25.0 20.0 Difference -(InBODY-BOD -20 15.0 10.0 5.0 0.0 5.0 15.0 25.0 35.0 45.0 6 5 10 12 14 16 18 20 22 24 26 28 30 32 34 36 38 40 Sofat BODPOD/Siri Mean =(InBODY+BODPOD)-2 Figure 8a. Association of 1Girth estimated Sofat and Figure 8b. Bland-Altman Plot of differences in estimated BODPOD/Siri estimated Sofat in Spring 2023 EXSC 415 students (1=6) body fat measured by 1GIRTH and BODPOD/Siri (Y) by mean (XX) in Spring 2023 EXSC 415 students (1=6) =0.4727x + 11.181 130 7 1=0.59,r'=0.3438, p>0.05 30.0 1=0.2, MeansciTH=MEAN DonPOD 9.0 7.0 5.0 25.0 Sofat 1 Girth 20.0 -5.0 15.0 -110- 10.0 -13.0 5.0 -170 5.0 10.0 15.0 20.0 25.0 30.0 35.0 40.0 Sofat BODPOD/Siri 6 5 10 12 14 16 19 20 22 24 26 28 30 32 34 36 Alean = (1 GIRTH-BODPOD)=2 BODPOD/SIX Scatterplots Figures Sa, Ga, 7a, Sa Bland-Altman Plots Figures 5b. 6b, 7b, 8b BI - close It - Is there a Is 95% CI Large close to Does 95%CI significant difference ange small includes "("? shared between X-axis mean or large? ariance? and T-axis mean? Figure 53/b 10.935 0.8746 JP(W) /Siri -0.3192 0.7918 YES, |4-321 Yes Yes SMALL Yes fairly No, but almost does Figure 6a/b 10.67 7 12.02 STYKU 0.6519 No. not NO No. It-1 72 Not ver (-10.5, -20) Yes Infrared SMALL really Figure 7a/ close 0.93 .8717 INBODY BEI -4 5685 1.1309 Yes NO, It -0.84 Yes fairly YES (3.5. -6.75 Yes small Figure 83/b 0.59 1.3486 1-GIRTH NO 11.18 0.4727 NO. It-0.2 No NO $.5. -10.0 Yes LARGE e 3 DELLView Acrobat Design Layout AaBbCcDC AaBbCCD( AaBDC AaBbca Aab AaBbCCC AaBbCODI AaBbCCD: AaBbCCD AaBbCcD T Normal I No Spac.. Heading 1 Heading 2 Title Subtitle Subtle Em... Emphasis Intense E.. Strong aph Styles 6. Examine Figures Sa/b through 8a/b (scatterplots/Bland-Altman plots) which compare BODPOD/Siri estimated %fat (X axis on Figures 5a, 6a, 7a, and Sa) to Jackson, Pollock (Ward)/Siri (Figure 5a/b), STYKU Infrared (Figure 6 a/b), INBODY BEI (Figure 7a/b), and 1-GIRTH (Figure 8 a/b). Identify the two (2) methods with the strongest association with BODPOD and the one (1) method with the weakest association with BODPOD. Use r, r, Bo (intercept), Bi (slope) and the comparison of MeanBODPOD and Meany Axis Method (It[) [all in Figs 5a, 6a 7a, 8a] and the 95% CI of the mean difference [in Fig 5b, 6b, 7b, 8b] in your answer. Figure Sa. Association of JP(W)/Siri estimated Sofar and Figure 5b. Bland-Altman Plot of differences in estimated BODPOD/Siri estimated $bfat in Spring 2023 EXSC 415 body fat measured by JP(W) Siri and BODPOD/Siri (Y) as Judents (1=6) by mean (0) in Spring 2023 EXSC 415 students (0=6). 12-10 y = 0.7918x - 0.3192 30.0 T=0.935, r'=0.8746, p=0.05 14=3.21, MEAN BODTOD MEAN IOM BODPOD) 25.0 E , A 2 15.0 3-10.0 10.0 -13 0 5.0 5.0 10.0 15.0 20.0 25.0 30.0 35.0 4020 1510 10.0 15.0 20.0 250 30.0 35.0 40.0 gofat BODPOD/Siri Mean =(JP()-BODPOD)-2 Figure 63. Association of STYKU IR estimated Sofat and Figure ob. Bland-Altman Plot of differences in estimated BODPOD/Siri estimated Sofat in Spring 2023 EXSC 415 body fat measured by STYKU IR and BODFOD Siri (Y) students (1=6) by mean (X) in Spring 2023 EXSC 415 students (1=6) 45.0 - 14.0 y = 0.6519x +12.025 12.0- 40.0 1 0.82, 17-0.6778, p30.05 DPOD 10.0 1 1 72, MEANSTEKL MEANSOOPOD so frared 6.0 30.0 4.0 25.0 20_0 -20 - -40 15.0 1-6.0 9.0 10.0 10 15 20 25 30 35 40 5.0 10.0 15.0 20.0 25.0 30.0 35.0 40.0 Mean =(STYKU IR-BODPOD)-2 Bufat BODPOD/Siri DELL
Step by Step Solution
There are 3 Steps involved in it

Get step-by-step solutions from verified subject matter experts