

Question: Please answer the question. TQ QUESTION 1: a) Ahmad, a QC manager was interested to find out if the bottling process in his factory is
Please answer the question. TQ
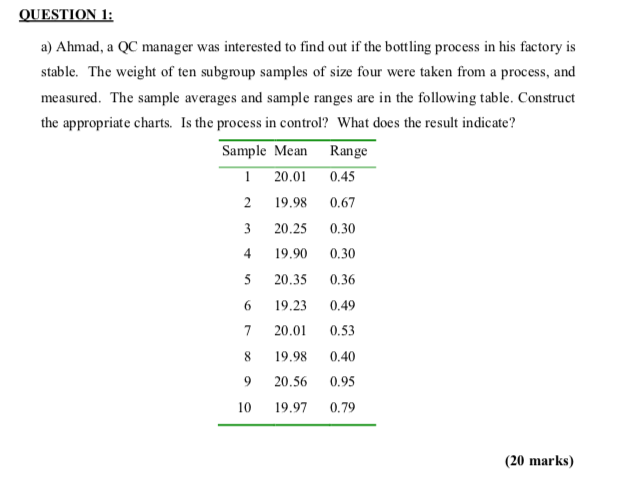
QUESTION 1: a) Ahmad, a QC manager was interested to find out if the bottling process in his factory is stable. The weight of ten subgroup samples of size four were taken from a process, and measured. The sample averages and sample ranges are in the following table. Construct the appropriate charts. Is the process in control? What does the result indicate? Sample Mean Range 1 20.01 0.45 2 19.98 0.67 3 20.25 0.30 4 19.90 0.30 5 20.35 0.36 6 19.23 0.49 7 20.01 0.53 8 19.98 0.40 9 20.56 0.95 10 19.97 0.79 (20 marks)Step by Step Solution
There are 3 Steps involved in it
1 Expert Approved Answer
Step: 1 Unlock

Question Has Been Solved by an Expert!
Get step-by-step solutions from verified subject matter experts
Step: 2 Unlock
Step: 3 Unlock