

Question: Please answer the questions below with up to two decimals for all calculated answers please & show all the working out of calculations & not
Please answer the questions below with up to two decimals for all calculated answers please & show all the working out of calculations & not just the final answer...
Question 1
An epidemiological study followed up 153 disease-free individuals for 12 months. During the follow up five individuals developed the disease after two months. Nine individuals were diagnosed at the end of six months (or at mid-point of the follow up) while three additional cases were recorded at the end of follow up.
a) Please calculate the Person-time in months.
b) Calculate Incidence rate & provide answer as per 1000 person-months.
Question 2
Provide description of the graph below
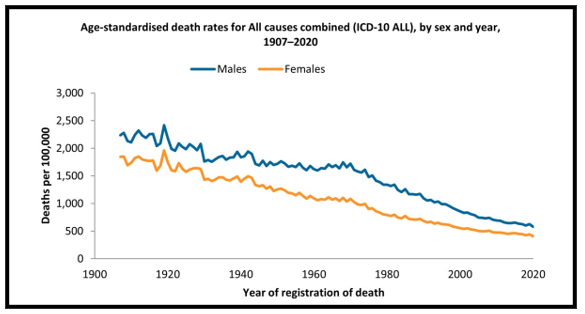
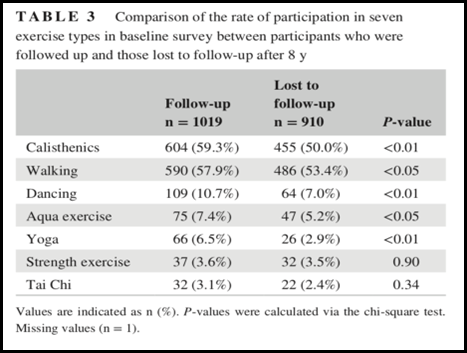
Age-standardised death rates for All causes combined (ICD-10 ALL), by sex and year, 1907-2020 Males Females 3,000 2,500 2,000 M Deaths per 100,000 1,500 1,000 500 0 1900 1920 1940 1960 1980 2000 2020 Year of registration of death0.8 Test A 0.6 TPF Test B 0.4 Chance level 0.2 0 0 0.2 0.4 0.6 0.8 1 FPFTABLE 3 Comparison of the rate of participation in seven exercise types in baseline survey between participants who were followed up and those lost to follow-up after 8 y Lost to Follow-up follow-up n = 1019 n = 910 P-value Calisthenics 604 (59.3%) 455 (50.0%)
Step by Step Solution
There are 3 Steps involved in it

Get step-by-step solutions from verified subject matter experts