

Question: please answer the second question. Refer to Tobin S6.1 - Facton for Comouting Control Chant Limits.(3 sigma) for this problem. Twelve samples, each containing five
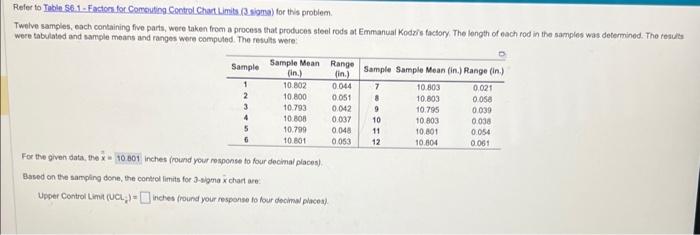
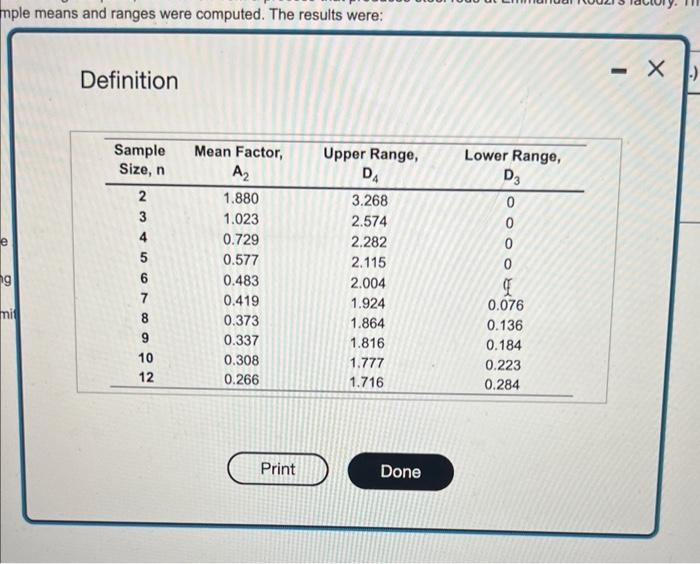
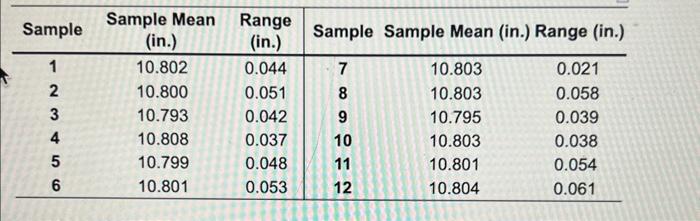
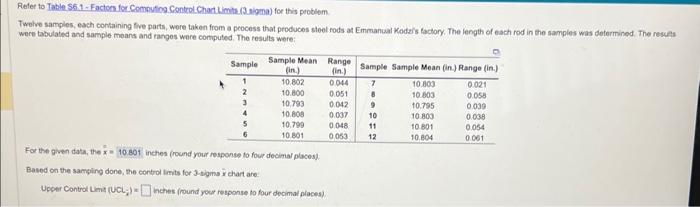
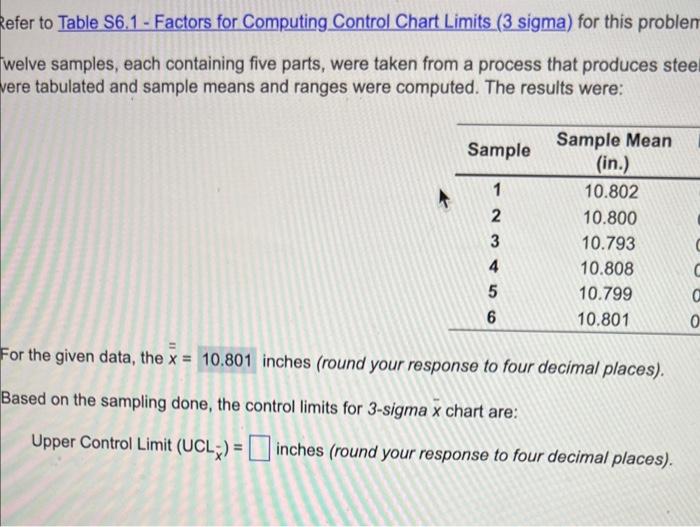
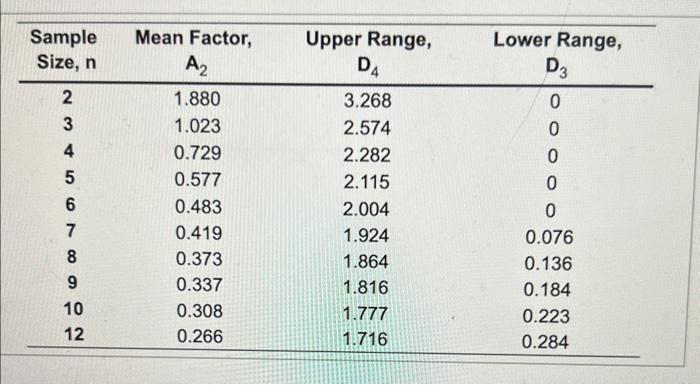
Refer to Tobin S6.1 - Facton for Comouting Control Chant Limits.(3 sigma) for this problem. Twelve samples, each containing five parts, were taken from a process that produces steel rods at Emmanual Kodris factory The longth of each rod in the samples was detemined. The resula were tabulated and sample means and ranges were compuled. The results were: For the given data, the : inches (round your rosponse to four decinal places). Based on the samping done, the contrel limits for 3-signa x char are. Upeter Control Limit (uCL.-)= inches (round your response to four decimal placest. mple means and ranges were computed. The results were: Definition \begin{tabular}{ccc|ccc} \hline Sample & SampleMean(in.) & Range(in.) & Sample Sample Mean (in.) Range (in.) \\ \hline 1 & 10.802 & 0.044 & 7 & 10.803 & 0.021 \\ 2 & 10.800 & 0.051 & 8 & 10.803 & 0.058 \\ 3 & 10.793 & 0.042 & 9 & 10.795 & 0.039 \\ 4 & 10.808 & 0.037 & 10 & 10.803 & 0.038 \\ 5 & 10.799 & 0.048 & 11 & 10.801 & 0.054 \\ 6 & 10.801 & 0.053 & 12 & 10.804 & 0.061 \\ \hline \end{tabular} Refer to Table 551 - Facton fer Combutiog Control Chart Limits.(3 sigma) for this probeem. Twelve samples, each containing five parts, wore taken from a peocess that produces stool rods at Emmanual Koders tactory. The length of each rod in the samples was determined, The resea s wece tabulated and sample means and rarges wore computed. The results were: For the given data, the inches (round your response to four decimal placesel Based on the sameing done, the cortroi lanits for J.tigins x char are. Upetr Controt Lint (SCLj) = hehes (round your retponse to four decimal places) welve samples, each containing five parts, were taken from a process that produces stee rere tabulated and sample means and ranges were computed. The results were: For the given data, the x=10.801 inches (round your response to four decimal places). Based on the sampling done, the control limits for 3-sigma x chart are: Upper Control Limit (UCL)= inches (round your response to four decimal places). \begin{tabular}{cccc} \hline SampleSize,n & MeanFactor,A2 & UpperRange,D4 & LowerRange,D3 \\ \hline 2 & 1.880 & 3.268 & 0 \\ 3 & 1.023 & 2.574 & 0 \\ 4 & 0.729 & 2.282 & 0 \\ 5 & 0.577 & 2.115 & 0 \\ 6 & 0.483 & 2.004 & 0 \\ 7 & 0.419 & 1.924 & 0.076 \\ 8 & 0.373 & 1.864 & 0.136 \\ 9 & 0.337 & 1.816 & 0.184 \\ 10 & 0.308 & 1.777 & 0.223 \\ 12 & 0.266 & 1.716 & 0.284 \\ \hline \end{tabular}
Step by Step Solution
There are 3 Steps involved in it

Get step-by-step solutions from verified subject matter experts