

Question: Please answer this question 28. Students in Mr. Smith's math class were asked if they can watch television and do math homework at the same
Please answer this question
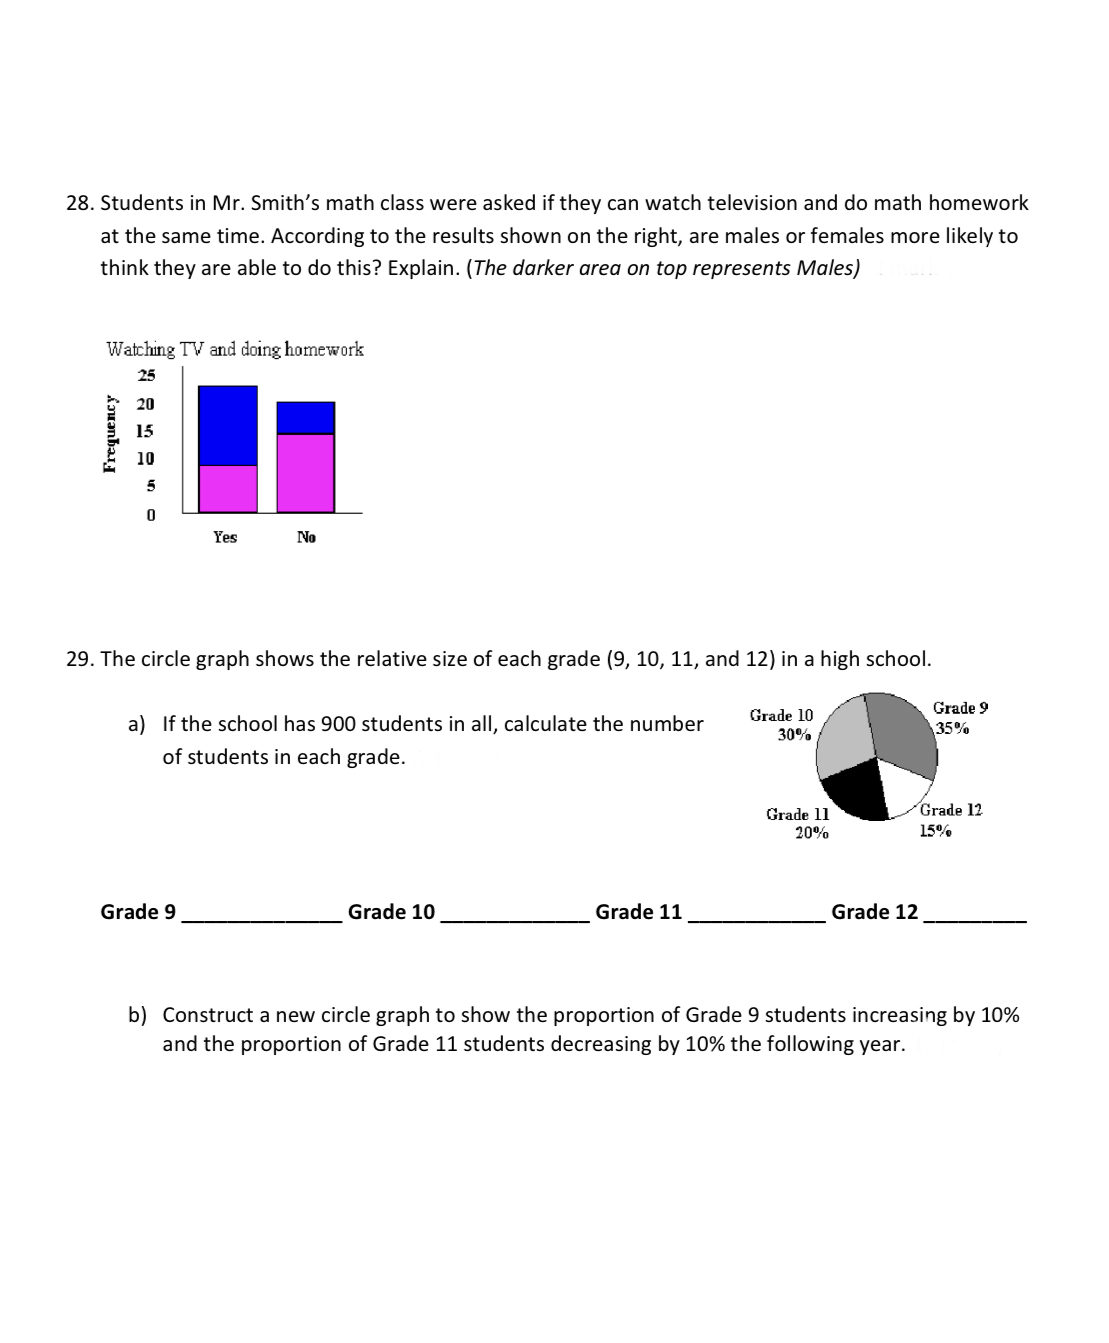
28. Students in Mr. Smith's math class were asked if they can watch television and do math homework at the same time. According to the results shown on the right, are males or females more likely to think they are able to do this? Explain. (The darker area on top represents Moles) Webbing TV and doing homework 25 2|] h i 15 Ill 5 I] Yes No 29. The circle graph shows the relative size of each grade (9, 10, 11, and 12) in a high school. . Grade 10 Gm\" 9 a) If the school has 900 students In all, calculate the number 30% 35% of students in each grade. Grade 11 Grade 11 20% 15% Grade 9 Grade 10 Grade 11 Grade 12 bl Construct a new circle graph to show the proportion of Grade 9 students increasing by 10% and the proportion of Grade 11 students decreasing by 10% the following year
Step by Step Solution
There are 3 Steps involved in it

Get step-by-step solutions from verified subject matter experts