

Question: please answer this question and not just repost another one with different numbers!! Thank you! Excel Online Structured Activity: Statistical Control Fawcet Bakery The following
please answer this question and not just repost another one with different numbers!! Thank you! 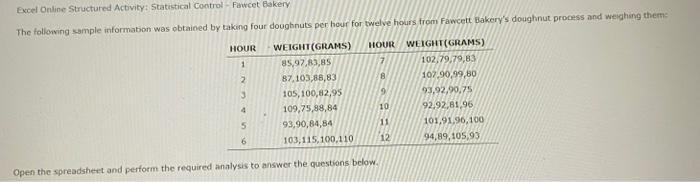
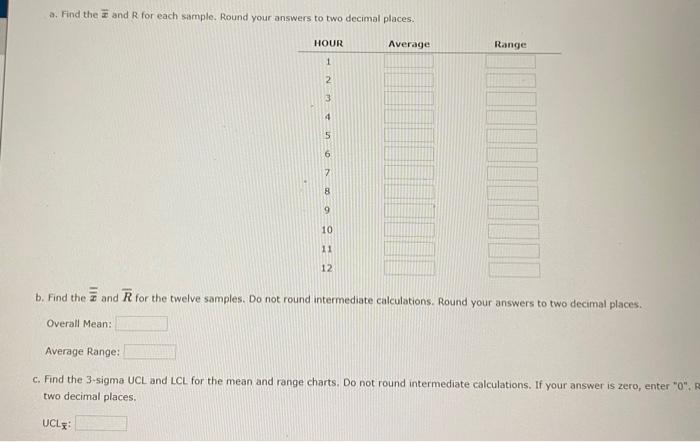
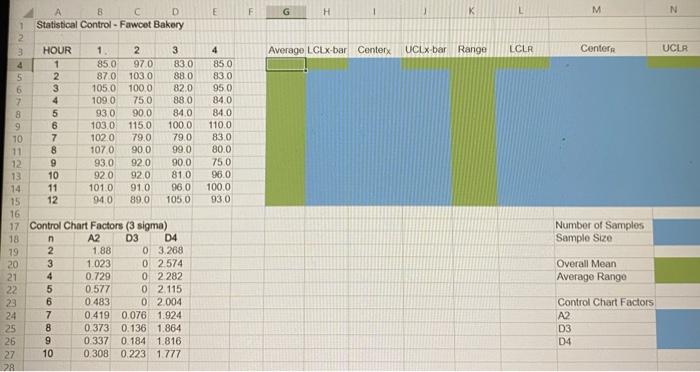
Excel Online Structured Activity: Statistical Control Fawcet Bakery The following sample information was obtained by taking four doughnuts per hour for twelve hours from Fawcett Bakery's doughnut process and weighing them HOUR HOUR 1 8 2 3 WEIGHT(GRAMS) 85,97,83,85 87,103,85,83 105, 100,82,95 109,75,88,84 93,90,84,84 103,115,100,110 9 WEIGHT(GRAMS) 102,79,79,83 107,90,99,00 93,92,90,75 92.92,81,96 101,91,96,100 94,89,105,93 10 4 11 5 12 6 Open the spreadsheet and perform the required analysis to answer the questions below a. Find the and R for each sample. Round your answers to two decimal places HOUR Average Range 1 2 UN 3 4 5 6 7 8 9 10 11 12 b. Find the and R for the twelve samples. Do not round intermediate calculations. Round your answers to two decimal places. Overall Mean: Average Range: c. Find the 3-sigma UCL and LCL for the mean and range charts. Do not round intermediate calculations. If your answer is zero, enter "O". two decimal places. UCLE E F G H K M N 3 Average LCLX-bar Center UCLX-bar 2 Range LCLR Centers UCLR ON D Statistical Control - Fawcet Bakery 2 3 HOUR 1 3 4 1 85.0 970 83.0 5 2 870 1030 880 6 3 105.0 1000 82.0 2 4 109.0 750 88.0 8 5 930 90.0 84.0 9 103.0 115.0 1000 10 1020 79,0 79.0 11 1070 900 990 12 93.0 920 90.0 13 10 920 920 810 14 11 1010 910 96.0 15 12 940 89.0 105.0 16 17 Control Chart Factors (3 sigma) 18 n A2 D3 D4 19 1.88 0 3.268 20 1.023 0 2574 21 0.729 0 2 282 22 0.577 0 2.115 23 0.483 02.004 24 0.419 0.076 1.924 25 0373 0.136 1.864 26 0.337 0.184 1.816 27 10 0.308 0.223 1.777 28 OOOEN 4 850 830 950 840 84.0 1100 830 80.0 750 95.0 100.0 930 Number of Samplos Sample Size Overall Mean Average Range OOO OOONE Control Chart Factors A2 D3 D4 Step by Step Solution
There are 3 Steps involved in it
1 Expert Approved Answer
Step: 1 Unlock

Question Has Been Solved by an Expert!
Get step-by-step solutions from verified subject matter experts
Step: 2 Unlock
Step: 3 Unlock