

Question: Please answer this question fully and in detail. Show step-by-step of the work. The following data relate the sales figures of the bar in Mark
Please answer this question fully and in detail. Show step-by-step of the work. 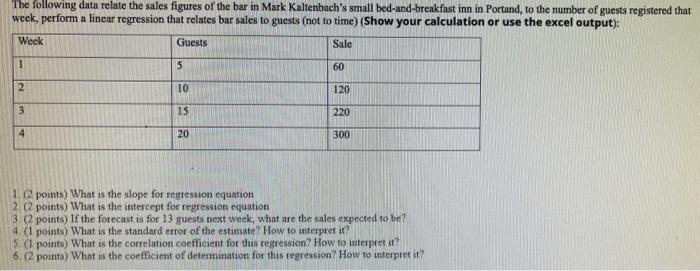
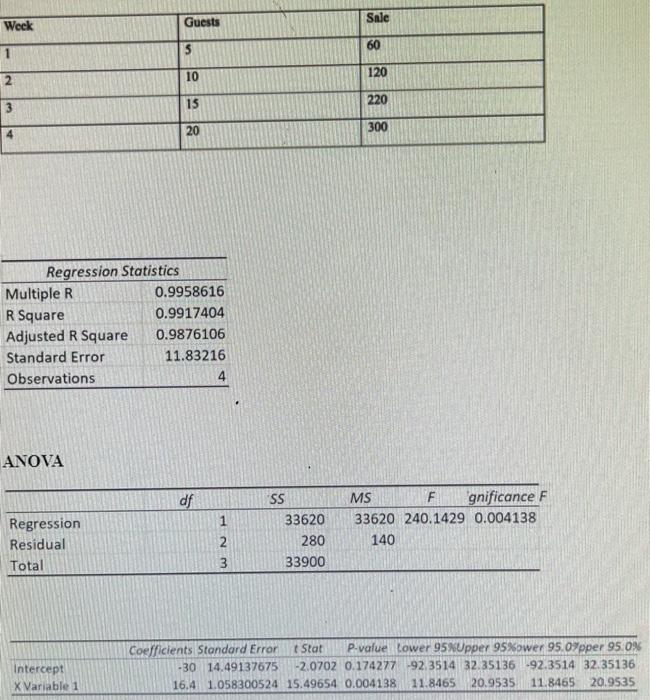
The following data relate the sales figures of the bar in Mark Kaltenbach's small bed-and-breakfast inn in Portand, to the number of guests registered that week, perform a linear regression that relates bar sales to guests (not to time) (Show your calculation or use the excel output): Week Guests Sale 1 5 60 2 10 120 3 15 220 4 20 300 1. (2 points) What is the slope for regression equation 2.(2 points) What is the intercept for regression equation 3 (2 points) If the forecast is for 13 guests next week, what are the sales expected to be? 4.(1 points) What is the standard error of the estimate? How to 5 ( points) What is the correlation coefficient for this regression? How to interpret it? 6. (2 points) What is the coefficient of determination for this regression? How to interpret it? pret it? Week Guests Sale 1 5 60 2 10 120 3 15 220 4 20 300 Regression Statistics Multiple R 0.9958616 R Square 0.9917404 Adjusted R Square 0.9876106 Standard Error 11.83216 Observations 4 ANOVA df Regression Residual Total 1 2 3 SS 33620 280 33900 MS F gnificance F 33620 240.1429 0.004138 140 wN Intercept Variable 1 Coefficients Standard Error Stat P-value Lower 95 Upper 95%ower 95.0%pper 95.0% -30 14.49137675 -2.0702 0.174277 -92.3514 32.35136 -92.3514 32.35136 16.4 1.058300524 15.49654 0.004138 11.8465 20.9535 11.8465 20.9535
Step by Step Solution
There are 3 Steps involved in it
1 Expert Approved Answer
Step: 1 Unlock

Question Has Been Solved by an Expert!
Get step-by-step solutions from verified subject matter experts
Step: 2 Unlock
Step: 3 Unlock