

Question: please answer this question These data relate the amount spent on groceries per week and the numbers of household members are X y 2 45.75
please answer this question
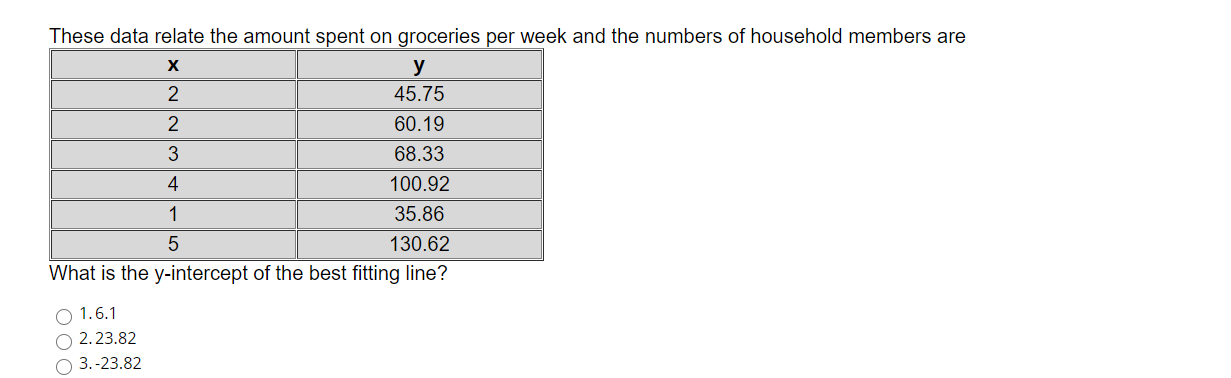
These data relate the amount spent on groceries per week and the numbers of household members are X y 2 45.75 2 60.19 3 68.33 4 100.92 35.86 5 130.62 What is the y-intercept of the best fitting line? O 1.6.1 2.23.82 3.-23.82
Step by Step Solution
There are 3 Steps involved in it
1 Expert Approved Answer
Step: 1 Unlock

Question Has Been Solved by an Expert!
Get step-by-step solutions from verified subject matter experts
Step: 2 Unlock
Step: 3 Unlock