

Question: please answer this use excel and step by step do IRR, NPV, MIRR, Payback, D.Payback Thank you! The Investment Detective The essence of capital budgeting

 please answer this use excel and step by step do IRR, NPV, MIRR, Payback, D.Payback
Thank you!
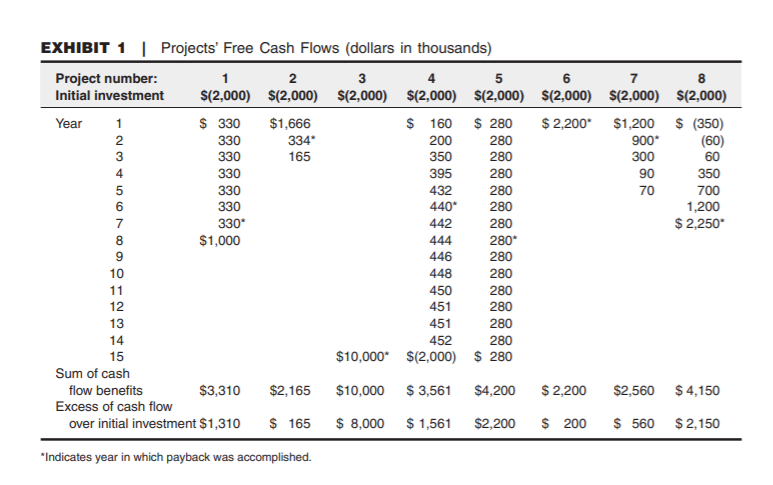
The Investment Detective The essence of capital budgeting and resource allocation is a search for good invest- ments to place the firm's capital. The process can be simple when viewed in purely mechanical terms, but a number of subtle issues can obscure the best investment choices. The capital-budgeting analyst, therefore, is necessarily a detective who must winnow bad evidence from good. Much of the challenge is in knowing what quanti- tative analysis to generate in the first place. Suppose you are a new capital-budgeting analyst for a company considering investments in the eight projects listed in Exhibit 1. The chief financial officer of your company has asked you to rank the projects and recommend the "four best that the company should accept. In this assignment, only the quantitative considerations are relevant. No other project characteristics are deciding factors in the selection, except that management has determined that projects 7 and 8 are mutually exclusive. All the projects require the same initial investment: $2 million. Moreover, all are believed to be of the same risk class. The firm's weighted average cost of capital has never been estimated. In the past, analysts have simply assumed that 10% was an appropriate discount rate (although certain officers of the company have recently asserted that the discount rate should be much higher). You should consider all of the methods you learned in class to inspect cashflows (IRR, NPV, MIRR, Payback, D. Payback). To stimulate your analysis, consider the following questions: 1. Can you rank the projects simply by inspecting the cash flows? 2. What criteria might you use to rank the projects? Which quantitative ranking methods are better? Why? 3. What is the ranking you found by using quantitative methods? Does this ranking differ from the ranking obtained by simple inspection of the cash flows? 4. What kinds of real investment projects have cash flows similar to those in Exhibit 1? 6 200 300 EXHIBIT 1 | Projects' Free Cash Flows (dollars in thousands) Project number: 1 2 3 4 5 7 8 Initial investment $(2,000) $(2,000) $(2,000) $(2,000) $(2,000) $(2,000) $(2,000) $(2,000) Year 1 $ 330 $1,666 $ 160 $ 280 $ 2,200 $1,200 $ (350) 2 330 334 280 900* (60) 3 330 165 350 280 60 4 330 395 280 90 350 5 330 432 280 70 700 6 330 440 280 1,200 7 330* 442 280 $2,250 8 $1,000 444 280* 9 446 280 10 448 280 11 450 280 12 280 13 451 280 14 452 280 15 $10,000* $(2,000) $ 280 Sum of cash flow benefits $3,310 $2,165 $10,000 $ 3,561 $4,200 $ 2,200 $2,560 $ 4,150 Excess of cash flow over initial investment $1,310 $ 165 $ 8,000 $1,561 $2,200 $ 200 $ 560 $ 2,150 451 *Indicates year in which payback was accomplished. The Investment Detective The essence of capital budgeting and resource allocation is a search for good invest- ments to place the firm's capital. The process can be simple when viewed in purely mechanical terms, but a number of subtle issues can obscure the best investment choices. The capital-budgeting analyst, therefore, is necessarily a detective who must winnow bad evidence from good. Much of the challenge is in knowing what quanti- tative analysis to generate in the first place. Suppose you are a new capital-budgeting analyst for a company considering investments in the eight projects listed in Exhibit 1. The chief financial officer of your company has asked you to rank the projects and recommend the "four best that the company should accept. In this assignment, only the quantitative considerations are relevant. No other project characteristics are deciding factors in the selection, except that management has determined that projects 7 and 8 are mutually exclusive. All the projects require the same initial investment: $2 million. Moreover, all are believed to be of the same risk class. The firm's weighted average cost of capital has never been estimated. In the past, analysts have simply assumed that 10% was an appropriate discount rate (although certain officers of the company have recently asserted that the discount rate should be much higher). You should consider all of the methods you learned in class to inspect cashflows (IRR, NPV, MIRR, Payback, D. Payback). To stimulate your analysis, consider the following questions: 1. Can you rank the projects simply by inspecting the cash flows? 2. What criteria might you use to rank the projects? Which quantitative ranking methods are better? Why? 3. What is the ranking you found by using quantitative methods? Does this ranking differ from the ranking obtained by simple inspection of the cash flows? 4. What kinds of real investment projects have cash flows similar to those in Exhibit 1? 6 200 300 EXHIBIT 1 | Projects' Free Cash Flows (dollars in thousands) Project number: 1 2 3 4 5 7 8 Initial investment $(2,000) $(2,000) $(2,000) $(2,000) $(2,000) $(2,000) $(2,000) $(2,000) Year 1 $ 330 $1,666 $ 160 $ 280 $ 2,200 $1,200 $ (350) 2 330 334 280 900* (60) 3 330 165 350 280 60 4 330 395 280 90 350 5 330 432 280 70 700 6 330 440 280 1,200 7 330* 442 280 $2,250 8 $1,000 444 280* 9 446 280 10 448 280 11 450 280 12 280 13 451 280 14 452 280 15 $10,000* $(2,000) $ 280 Sum of cash flow benefits $3,310 $2,165 $10,000 $ 3,561 $4,200 $ 2,200 $2,560 $ 4,150 Excess of cash flow over initial investment $1,310 $ 165 $ 8,000 $1,561 $2,200 $ 200 $ 560 $ 2,150 451 *Indicates year in which payback was accomplished
Step by Step Solution
There are 3 Steps involved in it

Get step-by-step solutions from verified subject matter experts