

Question: please answer :/ Use the provided data to answer all parts. Part 1: Calculate the final absorbances from the data below and enter the values
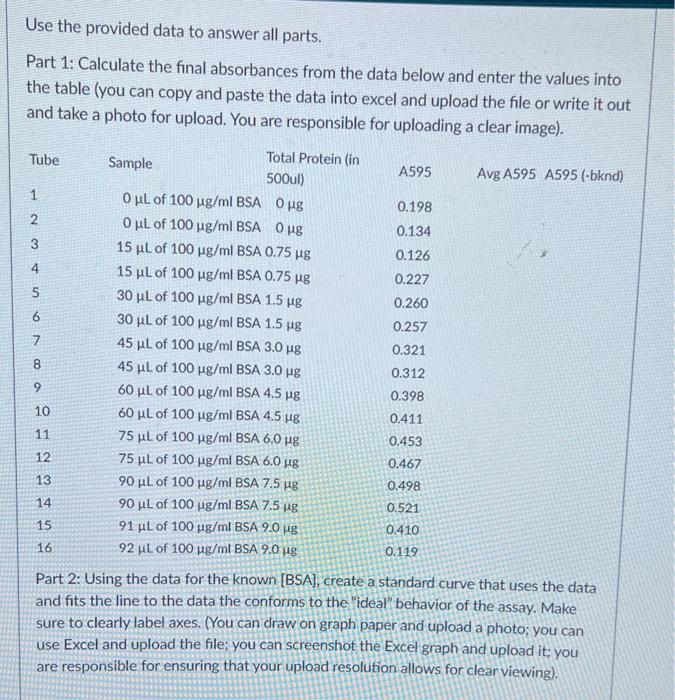
Use the provided data to answer all parts. Part 1: Calculate the final absorbances from the data below and enter the values into the table (you can copy and paste the data into excel and upload the file or write it out and take a photo for upload. You are responsible for uploading a clear image). Part 2: Using the data for the known [BSA], create a standard curve that uses the data and fits the line to the data the conforms to the ideal behavior of the assay. Make sure to clearly label axes. (You can draw on graph paper and upload a photo; you can use Excel and upload the file; you can screenshot the Excel graph and upload it; you are responsible for ensuring that your upload resolution allows for clear viewing). Use the provided data to answer all parts. Part 1: Calculate the final absorbances from the data below and enter the values into the table (you can copy and paste the data into excel and upload the file or write it out and take a photo for upload. You are responsible for uploading a clear image). Part 2: Using the data for the known [BSA], create a standard curve that uses the data and fits the line to the data the conforms to the ideal behavior of the assay. Make sure to clearly label axes. (You can draw on graph paper and upload a photo; you can use Excel and upload the file; you can screenshot the Excel graph and upload it; you are responsible for ensuring that your upload resolution allows for clear viewing)
Step by Step Solution
There are 3 Steps involved in it

Get step-by-step solutions from verified subject matter experts