

Question: Please answer using cell references Problem 10-18 Suppose that in April 2019, Nike had sales of $36,397 million, EBITDA of $5,219 million, excess cash of
Please answer using cell references
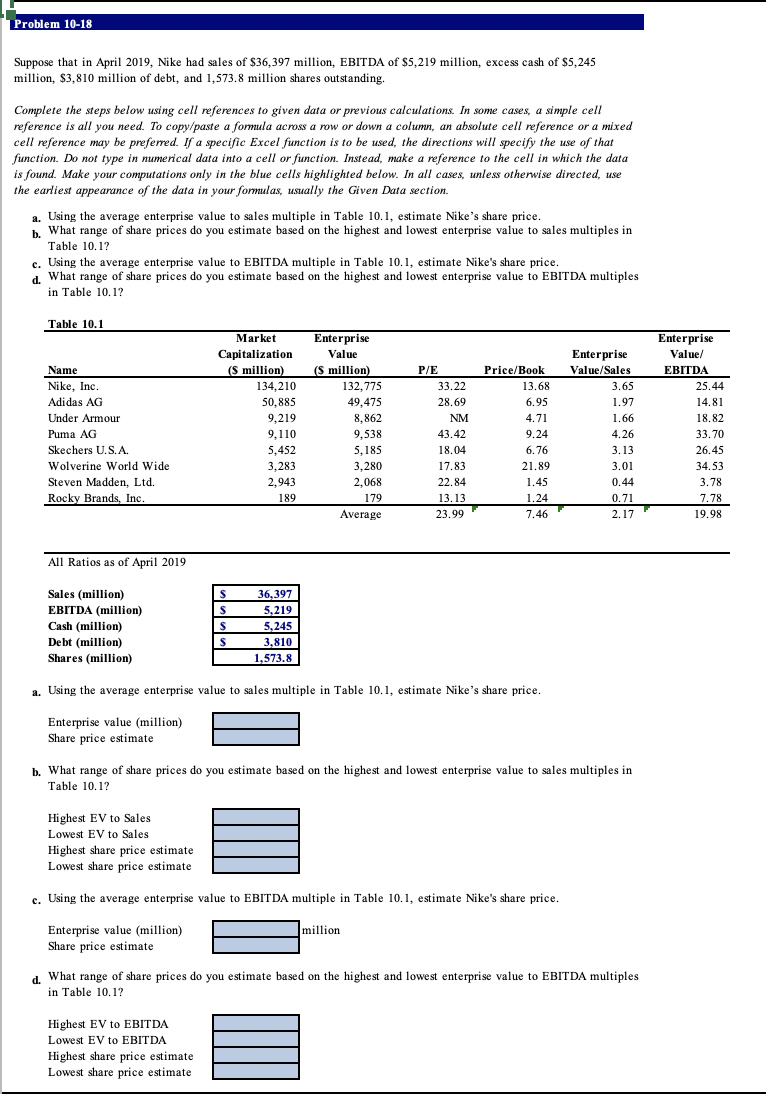
Problem 10-18 Suppose that in April 2019, Nike had sales of $36,397 million, EBITDA of $5,219 million, excess cash of $5,245 million, $3,810 million of debt, and 1,573.8 million shares outstanding. Complete the steps below using cell references to given data or previous calculations. In some cases, a simple cell reference is all you need. To copy/paste a formula across a row or down a column, an absolute cell reference or a mixed cell reference may be preferred. If a specific Excel function is to be used, the directions will specify the use of that function. Do not type in numerical data into a cell or function. Instead, make a reference to the cell in which the data is found. Make your computations only in the blue cells highlighted below. In all cases, unless otherwise directed, use the earliest appearance of the data in your formulas, usually the Given Data section. a. Using the average enterprise value to sales multiple in Table 10.1, estimate Nike's share price. b. What range of share prices do you estimate based on the highest and lowest enterprise value to sales multiples in Table 10.1? Using the average enterprise value to EBITDA multiple in Table 10.1, estimate Nike's share price. d. What range of share prices do you estimate based on the highest and lowest enterprise value to EBITDA multiples in Table 10.1? Table 10.1 Name Nike, Inc. Adidas AG Under Armour Buma Puma AG Skechers U.S.A. Wolverine World Wide Steven Madden, Ltd. Rocky Brands, Inc. Market Capitalization (5 million) 134,210 50,885 9,219 9,110 5,452 S15 3,283 2,943 189 Enterprise Value (s million) 132,775 49,475 88 8,862 520 9,538 5,185 3,280 2,068 179 Average P/E 33.22 28.69 NM 43.42 18.04 Price/Book 13.68 6.95 4.71 9.24 6.76 21.89 1.45 1.24 7.46 Enterprise Value/Sales 3.65 1.97 Lac 1.66 4.26 3.13 212 3.01 0.44 0.71 2.17 Enterprise Value/ EBITDA 25.44 14.81 18 82 18.82 33.70 23 20 26.45 34.53 3.78 7.78 19.98 17.82 22.84 13.13 23.99 All Ratios as of April 2019 S Sales (million) EBITDA (million) Cash (million) Debt million) Shares (million) s s 36,397 5,219 5,245 3,810 1,573.8 s a. Using the average enterprise value to sales multiple in Table 10.1, estimate Nike's share price. Enterprise value (million) Share price estimate b. What range of share prices do you estimate based on the highest and lowest enterprise value to sales multiples in Table 10.1? Highest EV to Sales Lowest EV to Sales Highest share price estimate Lowest share price estimate c. Using the average enterprise value to EBITDA multiple in Table 10.1, estimate Nike's share price. Enterprise value (million) Share price estimate million d. What range of share prices do you estimate based on the highest and lowest enterprise value to EBITDA multiples in Table 10.12 Highest EV to EBITDA Lowest EV to EBITDA Highest share price estimate Lowest share price estimate Problem 10-18 Suppose that in April 2019, Nike had sales of $36,397 million, EBITDA of $5,219 million, excess cash of $5,245 million, $3,810 million of debt, and 1,573.8 million shares outstanding. Complete the steps below using cell references to given data or previous calculations. In some cases, a simple cell reference is all you need. To copy/paste a formula across a row or down a column, an absolute cell reference or a mixed cell reference may be preferred. If a specific Excel function is to be used, the directions will specify the use of that function. Do not type in numerical data into a cell or function. Instead, make a reference to the cell in which the data is found. Make your computations only in the blue cells highlighted below. In all cases, unless otherwise directed, use the earliest appearance of the data in your formulas, usually the Given Data section. a. Using the average enterprise value to sales multiple in Table 10.1, estimate Nike's share price. b. What range of share prices do you estimate based on the highest and lowest enterprise value to sales multiples in Table 10.1? Using the average enterprise value to EBITDA multiple in Table 10.1, estimate Nike's share price. d. What range of share prices do you estimate based on the highest and lowest enterprise value to EBITDA multiples in Table 10.1? Table 10.1 Name Nike, Inc. Adidas AG Under Armour Buma Puma AG Skechers U.S.A. Wolverine World Wide Steven Madden, Ltd. Rocky Brands, Inc. Market Capitalization (5 million) 134,210 50,885 9,219 9,110 5,452 S15 3,283 2,943 189 Enterprise Value (s million) 132,775 49,475 88 8,862 520 9,538 5,185 3,280 2,068 179 Average P/E 33.22 28.69 NM 43.42 18.04 Price/Book 13.68 6.95 4.71 9.24 6.76 21.89 1.45 1.24 7.46 Enterprise Value/Sales 3.65 1.97 Lac 1.66 4.26 3.13 212 3.01 0.44 0.71 2.17 Enterprise Value/ EBITDA 25.44 14.81 18 82 18.82 33.70 23 20 26.45 34.53 3.78 7.78 19.98 17.82 22.84 13.13 23.99 All Ratios as of April 2019 S Sales (million) EBITDA (million) Cash (million) Debt million) Shares (million) s s 36,397 5,219 5,245 3,810 1,573.8 s a. Using the average enterprise value to sales multiple in Table 10.1, estimate Nike's share price. Enterprise value (million) Share price estimate b. What range of share prices do you estimate based on the highest and lowest enterprise value to sales multiples in Table 10.1? Highest EV to Sales Lowest EV to Sales Highest share price estimate Lowest share price estimate c. Using the average enterprise value to EBITDA multiple in Table 10.1, estimate Nike's share price. Enterprise value (million) Share price estimate million d. What range of share prices do you estimate based on the highest and lowest enterprise value to EBITDA multiples in Table 10.12 Highest EV to EBITDA Lowest EV to EBITDA Highest share price estimate Lowest share price estimate
Step by Step Solution
There are 3 Steps involved in it

Get step-by-step solutions from verified subject matter experts