

Question: please answer, will give a thumbs up. Bargain Deal, Inc., is a leading retailer specializing in consumer electronics. A condensed income statement and balance sheet
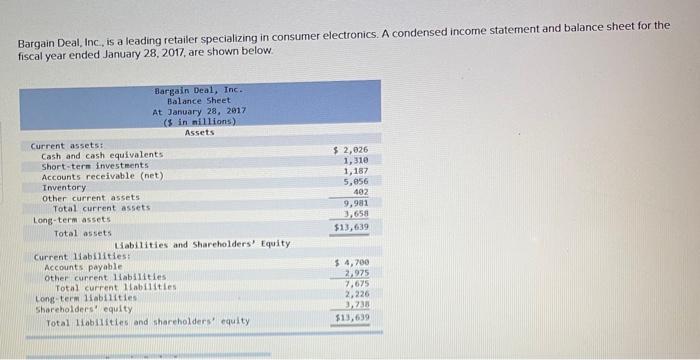
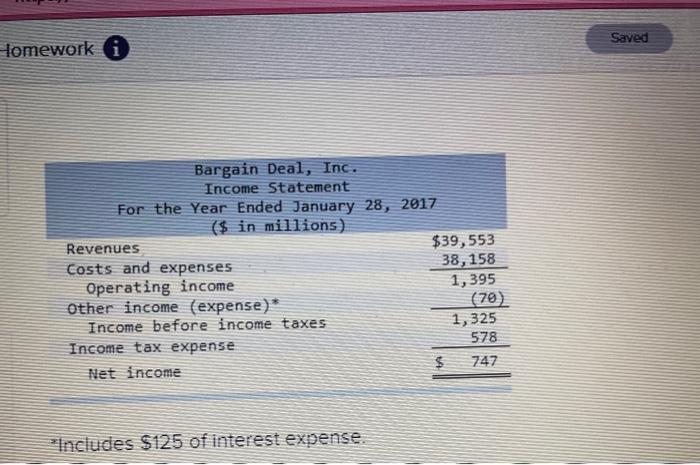
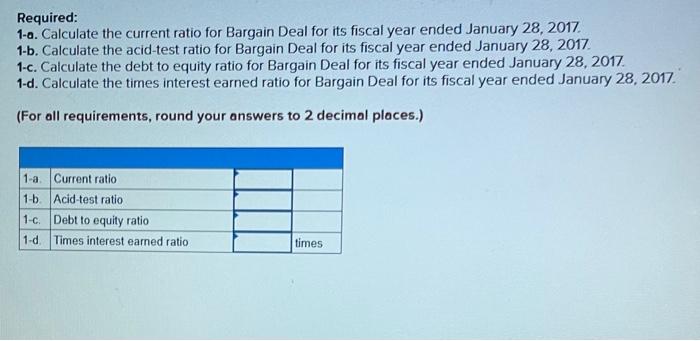
Bargain Deal, Inc., is a leading retailer specializing in consumer electronics. A condensed income statement and balance sheet for the fiscal year ended January 28, 2017, are shown below Bargain Deal, Inc. Balance Sheet At January 28, 2017 ($ in millions) Assets Current assets Cash and cash equivalents Short-term investments Accounts receivable (net) Inventory Other current assets Total current assets Long-term assets Total assets Liabilities and Shareholders' Equity Current liabilities: Accounts payable Other current liabilities Total current liabilities Long-term liabilities Shareholders equity Total liabilities and shareholders' equity $ 2,026 1,310 1,187 5.56 402 9,981 3,658 $13,639 $ 4,700 2,975 7,675 2,226 3,233 $13,639 Saved Homework Bargain Deal, Inc. Income Statement For the Year Ended January 28, 2017 ($ in millions) Revenues $39,553 costs and expenses 38,158 Operating income 1,395 other income (expense) (70) Income before income taxes 1, 325 Income tax expense 578 Net income $ 747 Includes $125 of interest exsense. Required: 1-0. Calculate the current ratio for Bargain Deal for its fiscal year ended January 28, 2017 1-b. Calculate the acid-test ratio for Bargain Deal for its fiscal year ended January 28, 2017 1-c. Calculate the debt to equity ratio for Bargain Deal for its fiscal year ended January 28, 2017 1-d. Calculate the times interest earned ratio for Bargain Deal for its fiscal year ended January 28, 2017 (For all requirements, round your answers to 2 decimal places.) 1-a Current ratio 1-5. Acid-test ratio 1-c. Debt to equity ratio 1-0 Times interest earned ratio times
Step by Step Solution
There are 3 Steps involved in it

Get step-by-step solutions from verified subject matter experts