

Question: Please answer with a MATLAB CODE. I already did the first part. here is the code I have done for the first part. 1. In
Please answer with a MATLAB CODE. I already did the first part.
here is the code I have done for the first part.
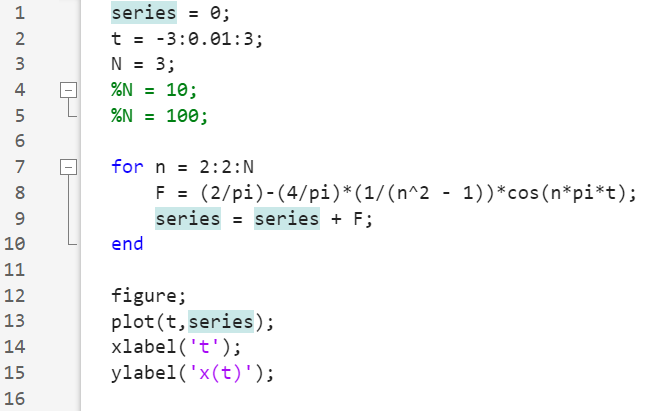
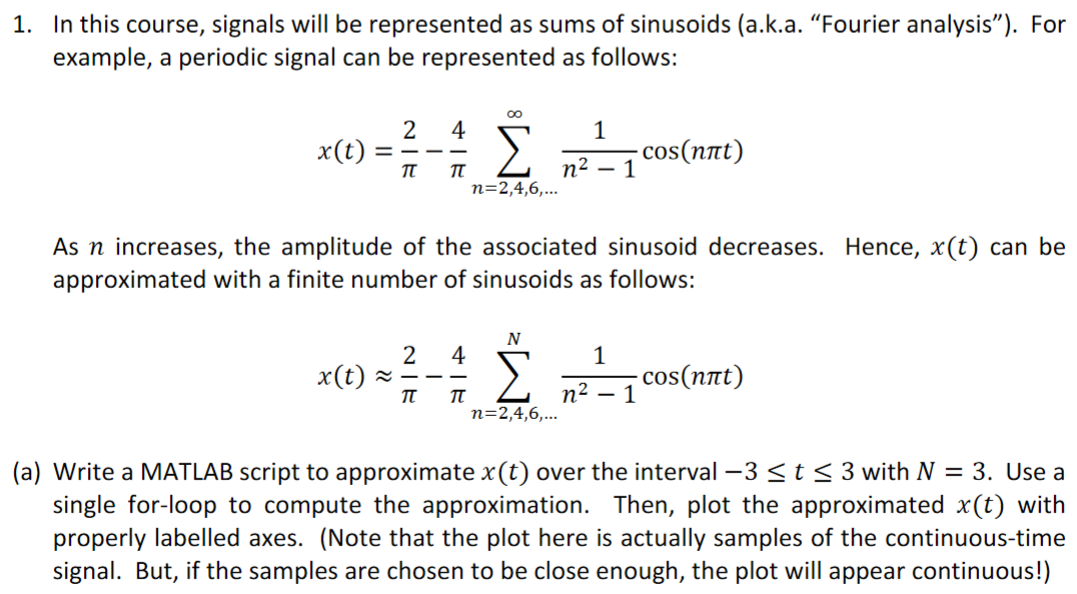
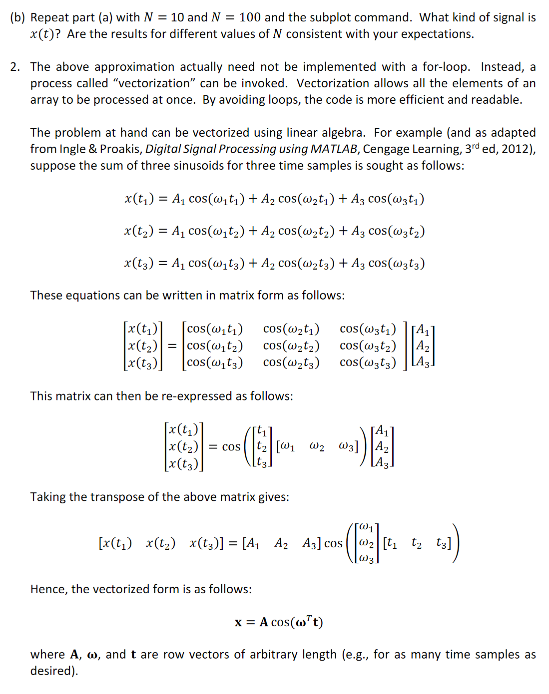
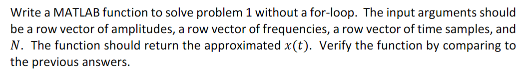
1. In this course, signals will be represented as sums of sinusoids (a.k.a. "Fourier analysis"). For example, a periodic signal can be represented as follows: x(t)=24n=2,4,6,n211cos(nt) As n increases, the amplitude of the associated sinusoid decreases. Hence, x(t) can be approximated with a finite number of sinusoids as follows: x(t)24n=2,4,6,Nn211cos(nt) a) Write a MATLAB script to approximate x(t) over the interval 3t3 with N=3. Use a single for-loop to compute the approximation. Then, plot the approximated x(t) with properly labelled axes. (Note that the plot here is actually samples of the continuous-time signal. But, if the samples are chosen to be close enough, the plot will appear continuous!) (b) Repeat part (a) with N=10 and N=100 and the subplot command. What kind of signal is x(t) ? Are the results for different values of N consistent with your expectations. 2. The above approximation actually need not be implemented with a for-loop. Instead, a process called "vectorization" can be invoked. Vectorization allows all the elements of an array to be processed at once. By avoiding loops, the code is more efficient and readable. The problem at hand can be vectorized using linear algebra. For example (and as adapted from Ingle \& Proakis, Digital Signal Processing using MATLAB, Cengage Learning, 3rd ed, 2012), suppose the sum of three sinusoids for three time samples is sought as follows: x(t1)=A1cos(1t1)+A2cos(2t1)+A3cos(3t1)x(t2)=A1cos(1t2)+A2cos(2t2)+A3cos(3t2)x(t3)=A1cos(1t3)+A2cos(2t3)+A3cos(3t3) These equations can be written in matrix form as follows: x(t1)x(t2)x(t3)=cos(1t1)cos(1t2)cos(1t3)cos(2t1)cos(2t2)cos(2t3)cos(3t1)cos(3t2)cos(3t3)A1A2A3 This matrix can then be re-expressed as follows: x(t1)x(t2)x(t3)=cost1t2t3[123]A1A2A3 Taking the transpose of the above matrix gives: [x(t1)x(t2)x(t3)]=[A1A2A3]cos123[t1t2t3] Hence, the vectorized form is as follows: x=Acos(Tt) where A,, and t are row vectors of arbitrary length (e.g., for as many time samples as desired). Write a MATLAB function to solve problem 1 without a for-loop. The input arguments should be a row vector of amplitudes, a row vector of frequencies, a row vector of time samples, and N. The function should return the approximated x(t). Verify the function by comparing to the previous answers. series =0; t=3:.01:3; N=3; %N=10; %N=100; for n=2:2:N F=(2/pi)(4/pi)(1/(n21))cos(npit); series = series +F; end figure; plot (t, series ) xlabel('t'); ylabel('x(t)')
Step by Step Solution
There are 3 Steps involved in it

Get step-by-step solutions from verified subject matter experts