

Question: Please be careful when answering. I really need to know how to do this correctly and my last questions I asked and got were incorrect.
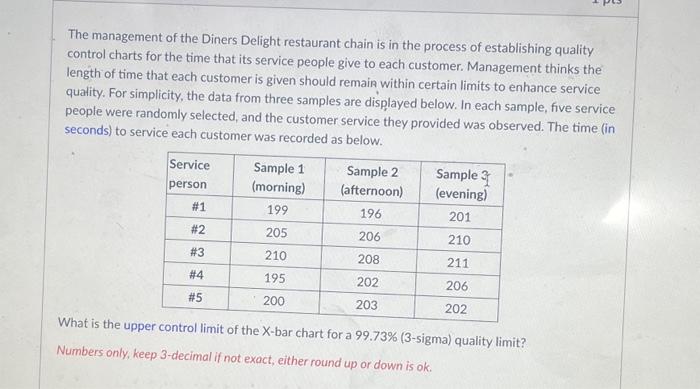
The management of the Diners Delight restaurant chain is in the process of establishing quality control charts for the time that its service people give to each customer. Management thinks the length of time that each customer is given should remaik within certain limits to enhance service quality. For simplicity, the data from three samples are displayed below. In each sample, five service people were randomly selected, and the customer service they provided was observed. The time (in seconds) to service each customer was recorded as below. What is the upper control limit of the X-bar chart for a 99.73% (3-sigma) quality limit? Numbers only, keep 3-decimal if not exact, either round up or down is ok
Step by Step Solution
There are 3 Steps involved in it

Get step-by-step solutions from verified subject matter experts