

Question: take the GE Stock Price and the S&P 500 Index as givens. Just enter the numbers. Columns 5-10 results should be created with formulas.
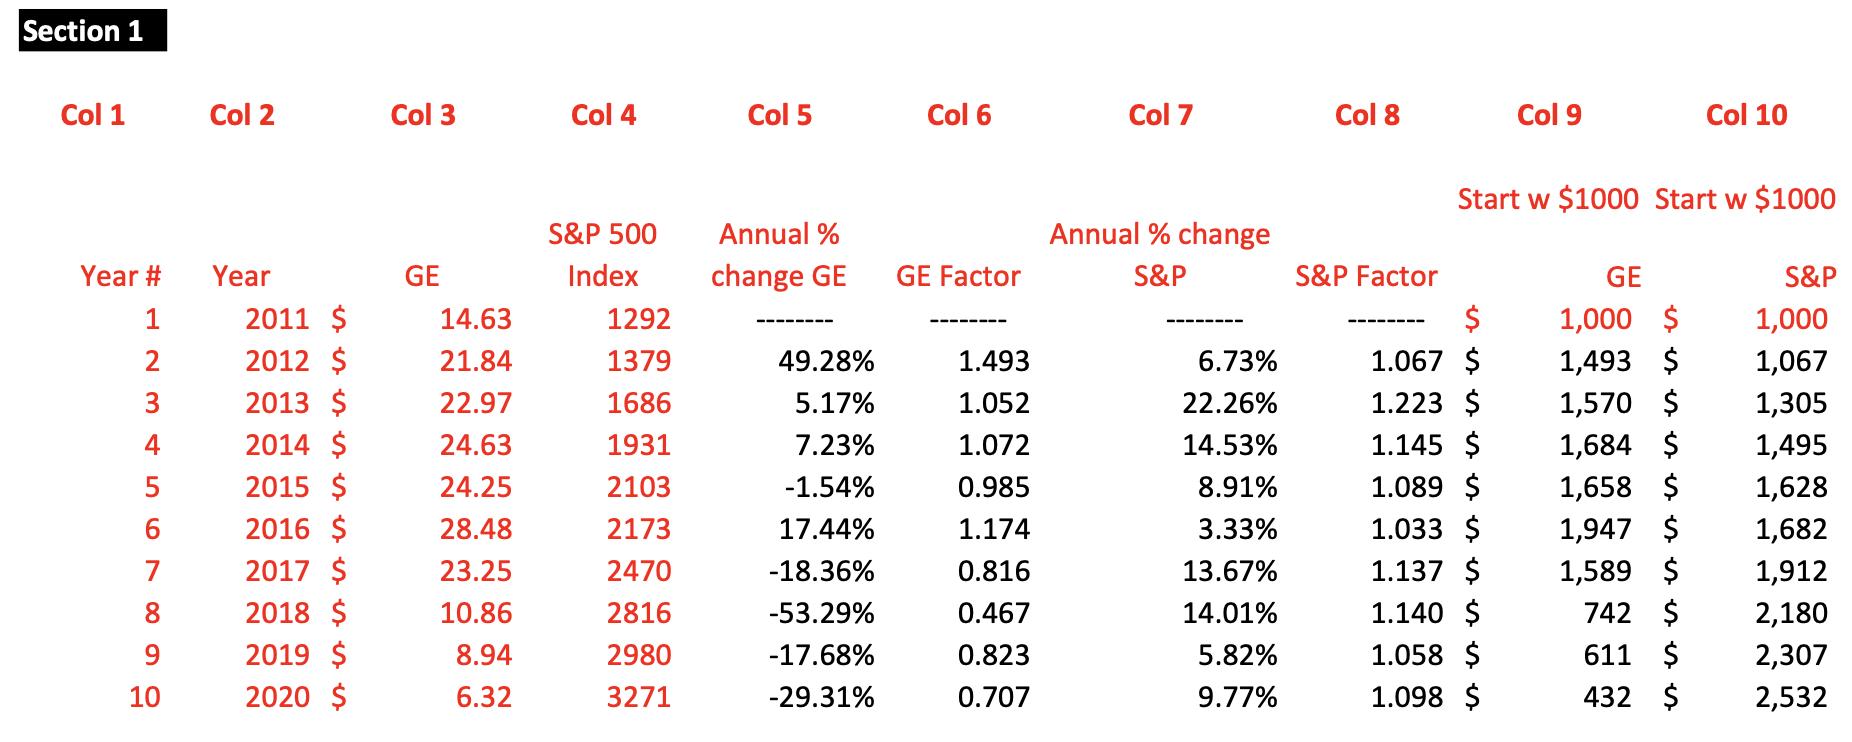
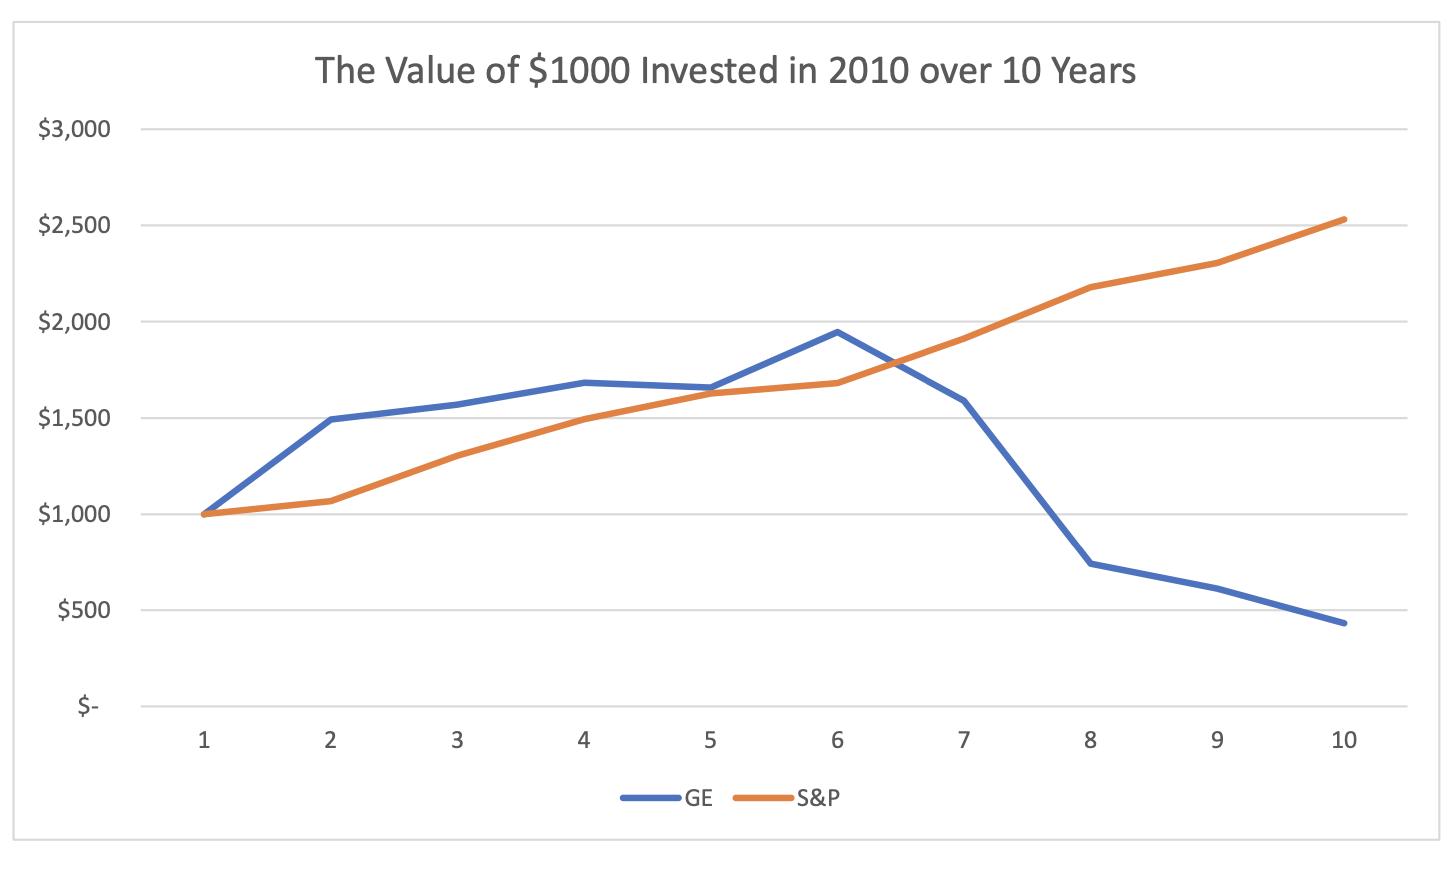
take the GE Stock Price and the S&P 500 Index as "givens". Just enter the numbers. Columns 5-10 results should be created with formulas. (This means that you must use a formula to calculate the 49.28% in the row for year 2 for column 5). Note that Column 5 is the annaul percent change in the stock price for GE. For example, when GE stock increased from $14.63 in 2011 to $21.84 in 2012, the % change was 49.28%. Column 6 (GE Factor) is 1+column 5. Columns 7 & 8 refer to the S&P 500. Column 9 shows what would happen if you invested $1000 in GE Stock in 2011. Note you would only have $432 in 2020. Note that the first entry of columns 9 and 10 is $1000, which is entered and not calculated as a formula. The other entries in columns 9 and 10 are calculated with formulas. Column 10 shows what would happen with a $1000 investment using the S&P 500. Create the graph in section 1 next to the table. I'll add 1 point of extra credit if you can display the years (2011 through 2020) on the horizontal axis. Take the average of the entries in column 5 and confirm that the result is -4.5618% Find the annualized return and confirm that it is -8.9045% Show me the Excel formula. Go to column 3. Create a fraction (End/Beginning). Raise this fraction to the 1/9 power. Subtract 1. Use Excel to calculate the 9th root of 78815.63867 Calculate the correlation between GE and the S&P 500. You can use Data Analysis in Excel. Or you can go online and find a correlation calculator. Go to Investopedia.com. Look for "What does a negative correlation coefficient mean?" Based on information on this webpage, state whether the correlation result is positive or negative, and the strength of the correlation. Interpret this in plain English. (or as plain as possible). Using Excel formula =geomean, calculate the geometric mean of the factors in column 6. Subtract 1 from the geometric mean. Find a stock that interests you and record its price on or around July 1 for 2011 through 2020. You can be close (within a month) of 2020. Get the data from a stock price chart. You can go online to Yahoo Finance and find specific stock prices. Or feel free to find another site. Record the results in a table showing price by year. You will have 10 entries. Very briefly, what is the S&P 500? What's the DJIA (Dow Jones Industrial Average)? Section 1 Col 1 Col 2 Col 3 Col 4 Col 5 Col 6 Col 7 Col 8 Col 9 Col 10 Start w $1000 Start w $1000 S&P 500 Annual % Annual % change Year # Year GE Index change GE GE Factor S&P S&P Factor GE S&P 2011 $ 2$ 1.067 $ 1,000 $ 1,493 $ 1,570 $ 1,684 $ 1,658 $ 1,947 $ 1,589 $ 742 $ 1 14.63 1292 1,000 ---- ---- 2012 $ 2013 $ 2 21.84 1379 49.28% 1.493 6.73% 1,067 3 22.97 1686 5.17% 1.052 22.26% 1.223 $ 1,305 2014 $ 2015 $ 2016 $ 2017 $ 1.145 $ 1.089 $ 1.033 $ 1.137 $ 1.140 $ 1.058 $ 1.098 $ 24.63 1931 7.23% 1.072 14.53% 1,495 24.25 2103 -1.54% 0.985 8.91% 1,628 6. 28.48 2173 17.44% 1.174 3.33% 1,682 7 23.25 2470 -18.36% 0.816 13.67% 1,912 2018 $ 2019 $ 2020 $ 10.86 2816 -53.29% 0.467 14.01% 2,180 9 8.94 2980 -17.68% 0.823 5.82% 611 $ 2,307 10 6.32 3271 -29.31% 0.707 9.77% 432 $ 2,532 The Value of $1000 Invested in 2010 over 10 Years $3,000 $2,500 $2,000 $1,500 $1,000 $500 S. 1 2 3 4 6. 7 8. 9 10 GE S&P
Step by Step Solution
3.40 Rating (156 Votes )
There are 3 Steps involved in it

Get step-by-step solutions from verified subject matter experts