

Question: 1 2 points Print References a. Complete the total revenue column from the demand-schedule data given below. Quantity Demanded 1 2 3 4 5
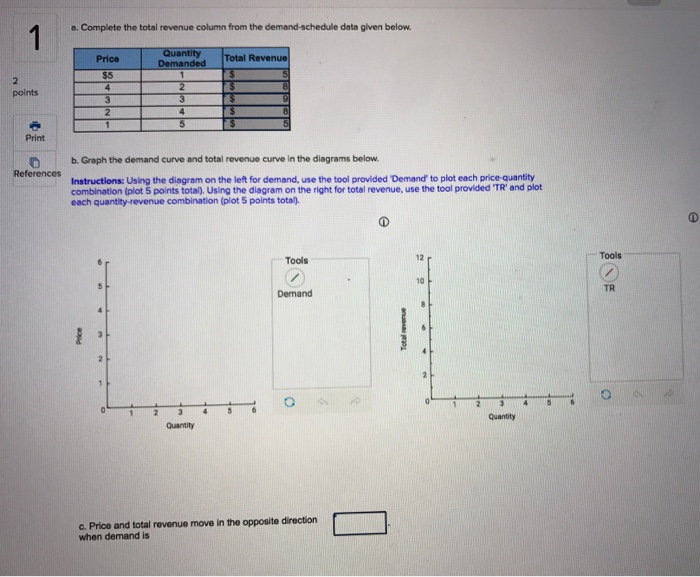
1 2 points Print References a. Complete the total revenue column from the demand-schedule data given below. Quantity Demanded 1 2 3 4 5 Price $5 4 3 2 1 2 2 b. Graph the demand curve and total revenue curve in the diagrams below. Instructions: Using the diagram on the left for demand, use the tool provided 'Demand' to plot each price-quantity combination (plot 5 points total). Using the diagram on the right for total revenue, use the tool provided 'TR' and plot each quantity-revenue combination (plot 5 points total). Quantity Total Revenue $ $ $ 4 $ $ 5 8 9 8 Tools Demand O c. Price and total revenue move in the opposite direction when demand is e Total revenue 10 2 Quantity Tools TR O 1 2 points Print References a. Complete the total revenue column from the demand-schedule data given below. Quantity Demanded 1 2 3 4 5 Price $5 4 3 2 1 2 2 b. Graph the demand curve and total revenue curve in the diagrams below. Instructions: Using the diagram on the left for demand, use the tool provided 'Demand' to plot each price-quantity combination (plot 5 points total). Using the diagram on the right for total revenue, use the tool provided 'TR' and plot each quantity-revenue combination (plot 5 points total). Quantity Total Revenue $ $ $ 4 $ $ 5 8 9 8 Tools Demand O c. Price and total revenue move in the opposite direction when demand is e Total revenue 10 2 Quantity Tools TR O 1 2 points Print References a. Complete the total revenue column from the demand-schedule data given below. Quantity Demanded 1 2 3 4 5 Price $5 4 3 2 1 2 2 b. Graph the demand curve and total revenue curve in the diagrams below. Instructions: Using the diagram on the left for demand, use the tool provided 'Demand' to plot each price-quantity combination (plot 5 points total). Using the diagram on the right for total revenue, use the tool provided 'TR' and plot each quantity-revenue combination (plot 5 points total). Quantity Total Revenue $ $ $ 4 $ $ 5 8 9 8 Tools Demand O c. Price and total revenue move in the opposite direction when demand is e Total revenue 10 2 Quantity Tools TR O 1 2 points Print References a. Complete the total revenue column from the demand-schedule data given below. Quantity Demanded 1 2 3 4 5 Price $5 4 3 2 1 2 2 b. Graph the demand curve and total revenue curve in the diagrams below. Instructions: Using the diagram on the left for demand, use the tool provided 'Demand' to plot each price-quantity combination (plot 5 points total). Using the diagram on the right for total revenue, use the tool provided 'TR' and plot each quantity-revenue combination (plot 5 points total). Quantity Total Revenue $ $ $ 4 $ $ 5 8 9 8 Tools Demand O c. Price and total revenue move in the opposite direction when demand is e Total revenue 10 2 Quantity Tools TR O 1 2 points Print References a. Complete the total revenue column from the demand-schedule data given below. Quantity Demanded 1 2 3 4 5 Price $5 4 3 2 1 2 2 b. Graph the demand curve and total revenue curve in the diagrams below. Instructions: Using the diagram on the left for demand, use the tool provided 'Demand' to plot each price-quantity combination (plot 5 points total). Using the diagram on the right for total revenue, use the tool provided 'TR' and plot each quantity-revenue combination (plot 5 points total). Quantity Total Revenue $ $ $ 4 $ $ 5 8 9 8 Tools Demand O c. Price and total revenue move in the opposite direction when demand is e Total revenue 10 2 Quantity Tools TR O
Step by Step Solution
3.39 Rating (174 Votes )
There are 3 Steps involved in it
Question PRICE QD 5 1 4 2 3 3 2 4 1 5 PRICE QD TR 5 1 ... View full answer

Get step-by-step solutions from verified subject matter experts