

Question: Please check whether my interpretation is correct. Check if any change is required to get it fixed. p) Students who study for more number of
Please check whether my interpretation is correct. Check if any change is required to get it fixed.
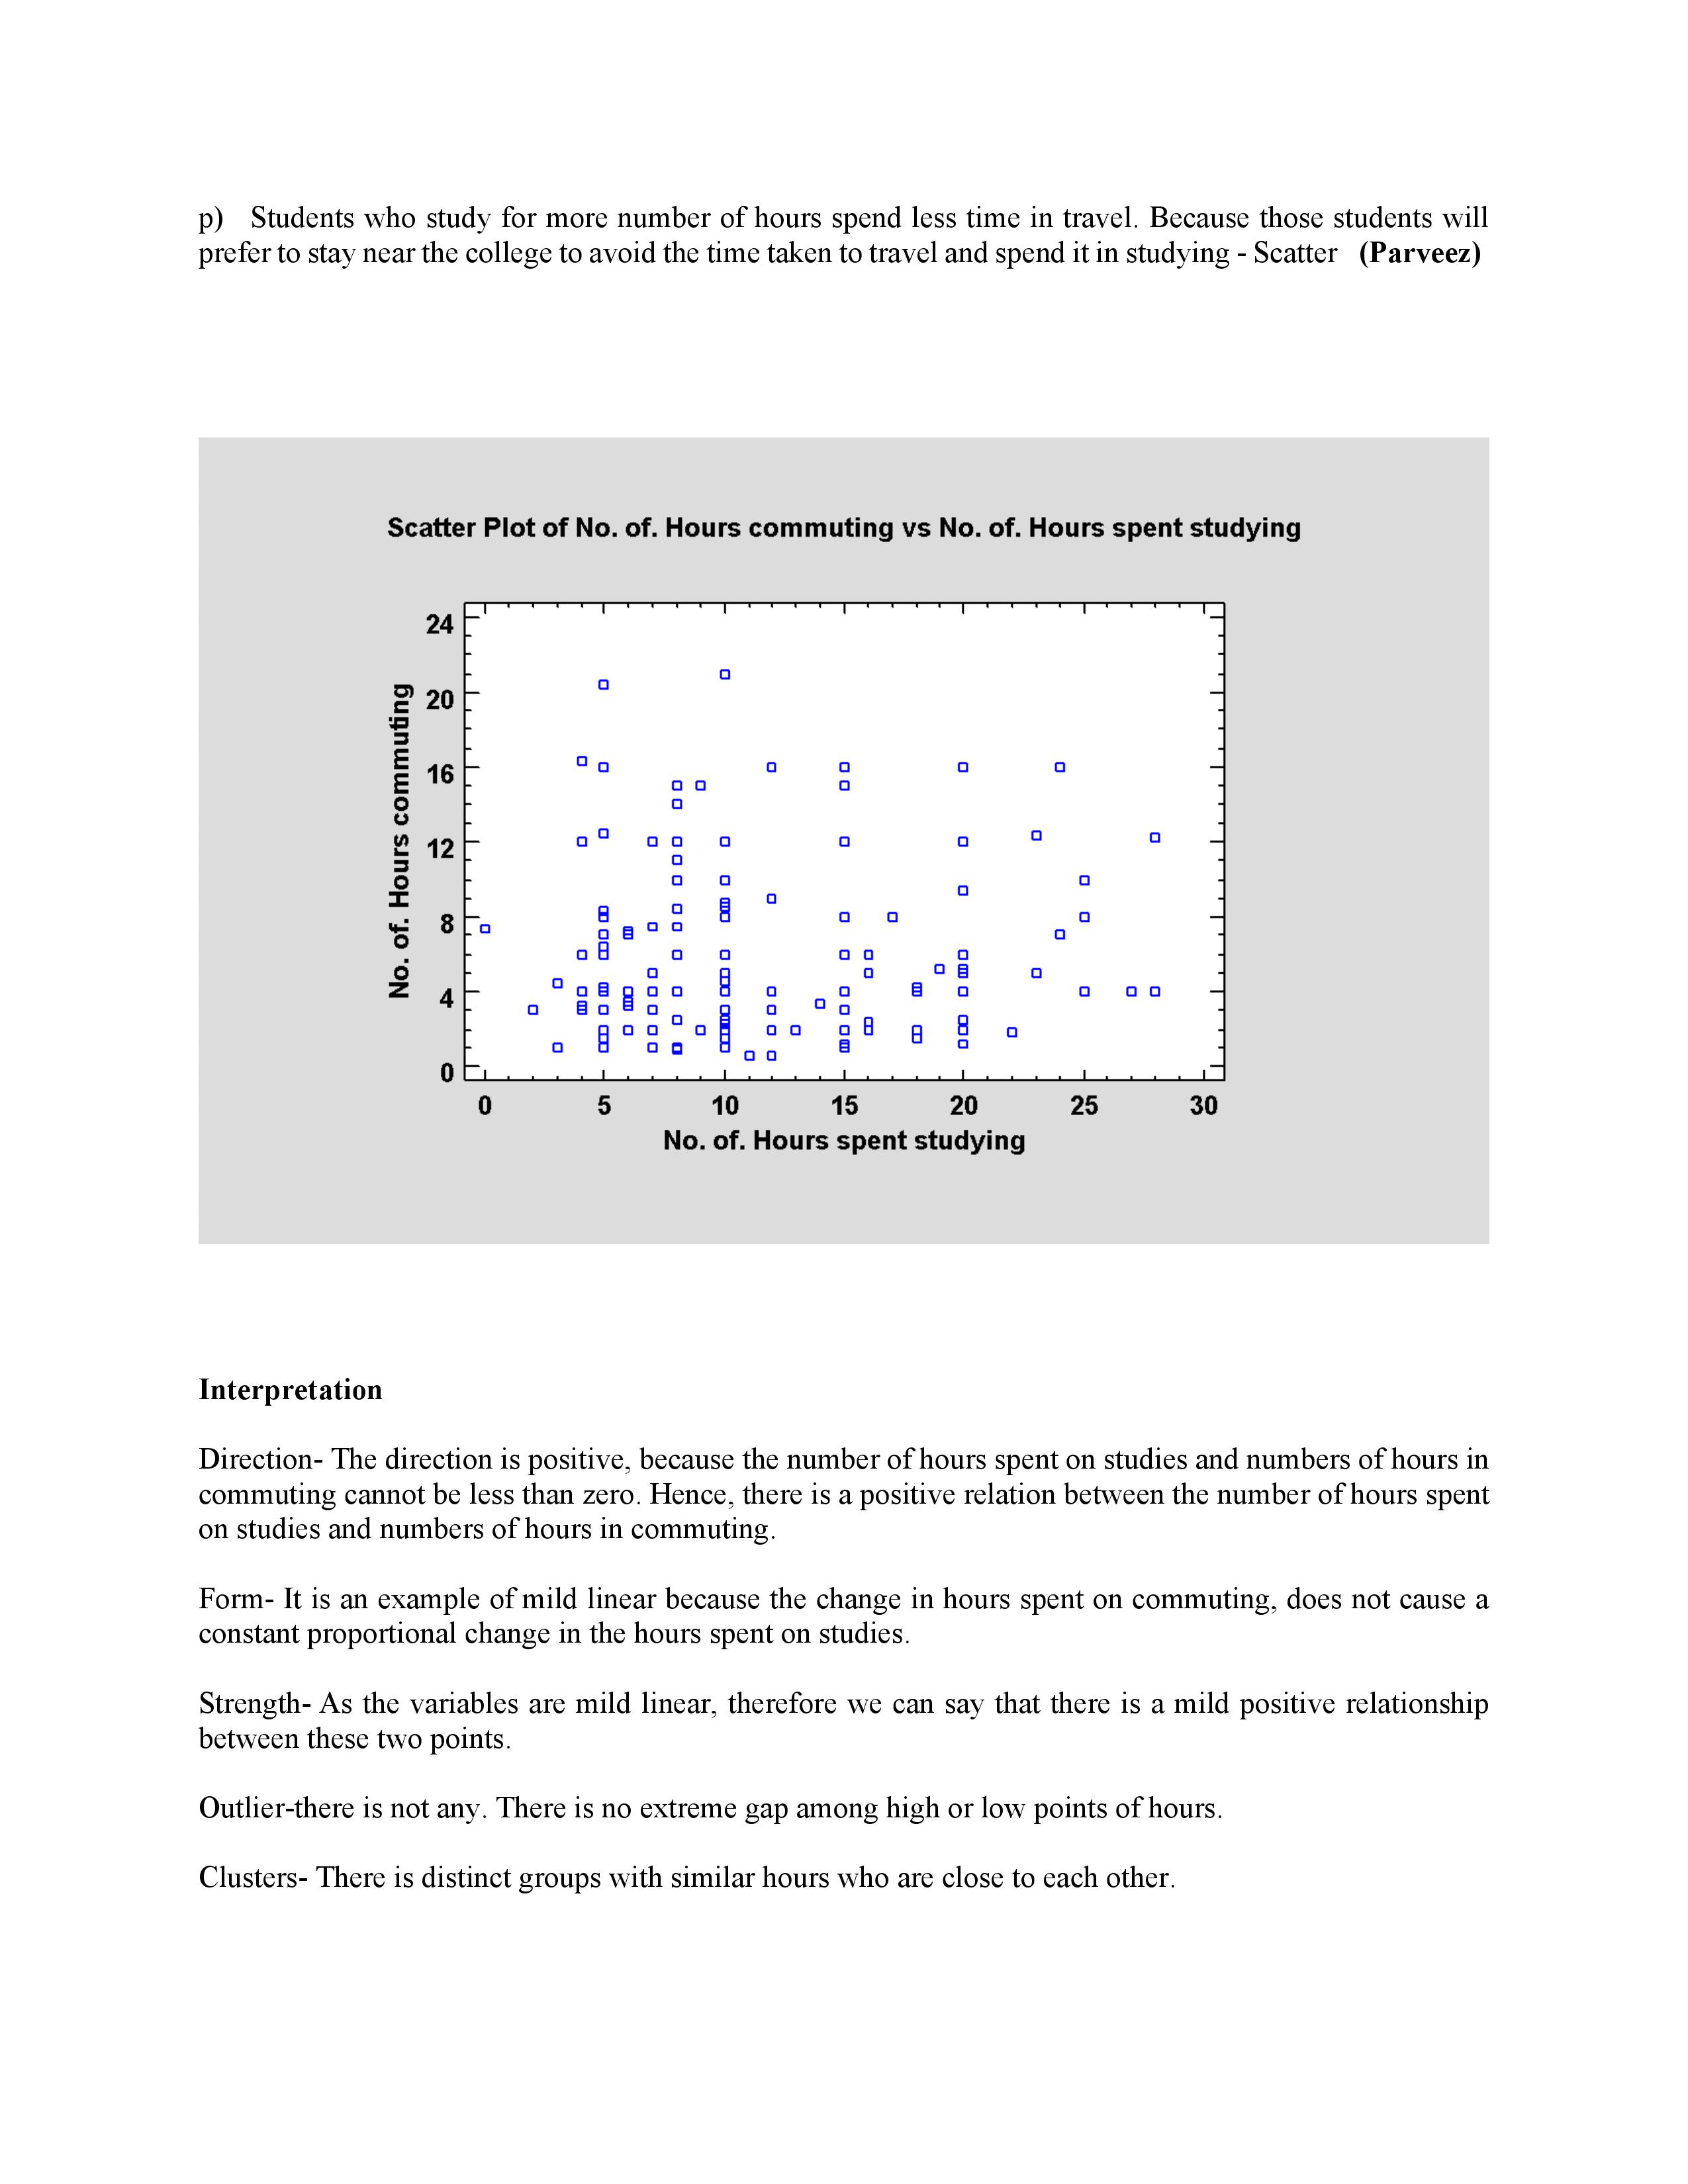
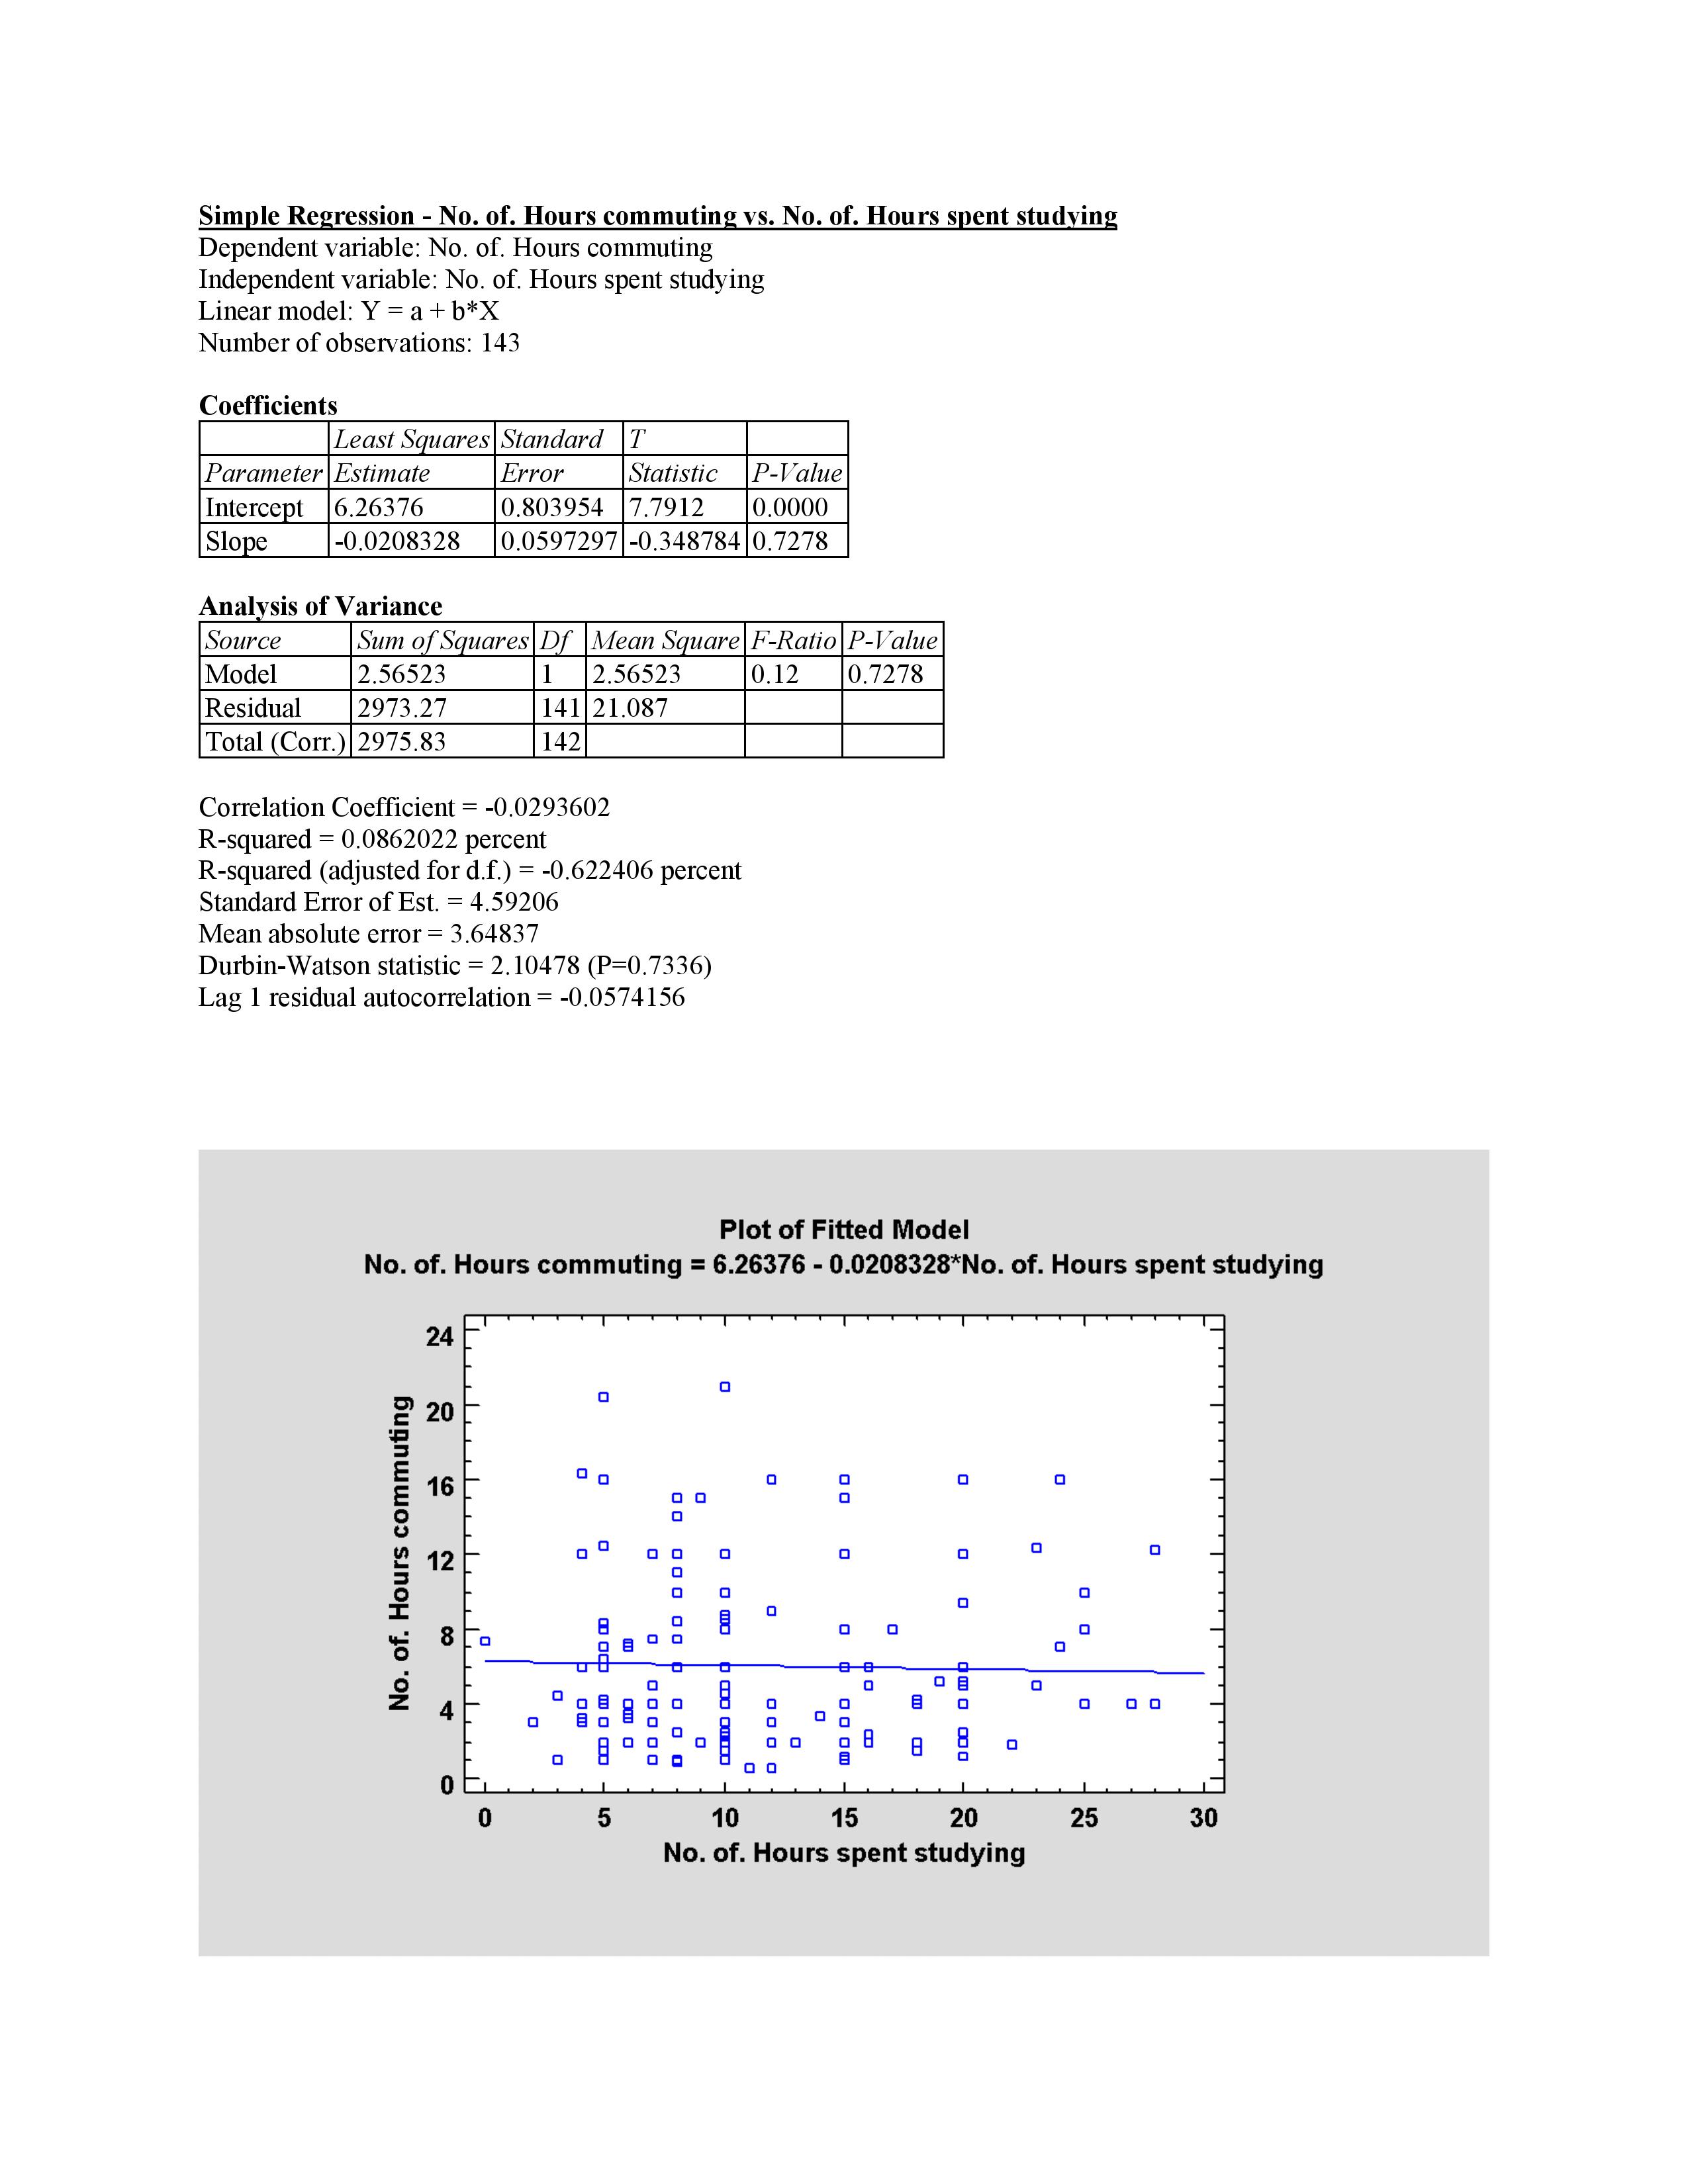
p) Students who study for more number of hours spend less time in travel. Because those students will prefer to stay nearthe college to avoid the time taken to travel and spend it in studying - Scatter (Parveez) D D E III E D D U u D D D u DUDE Interpretation Direction The direction is positive, because the number of hours spent on studies and numbers of hours in commuting cannot be less than zero. Hence, there is a positive relation between the number of hours spent on studies and numbers of hours in commuting. Form- It is an example of mild linear because the change in hours spent on commuting, does not cause a constant proportional change in the hours spent on studies. Strength- As the variables are mild linear, therefore we can say that there is a mild positive relationship between these two points. Outlierthere is not any. There is no extreme gap among high or low points of hours. Clusters- There is distinct groups with similar hours who are close to each other. Simple Regression - No. of. Hours commuting vs. No. of. Hours spent studying Dependent variable: No. of. Hours commuting Independent variable: No. of. Hours spent studying Linear model: Y = a + b*X Number of observations: 143 Coefficients Least Squares Standard T Parameter Estimate Error Statistic P-Value Intercept 6.26376 0.803954 7.7912 0.0000 Slope -0.0208328 0.0597297 -0.348784 0.7278 Analysis of Variance Source Sum of Squares Df Mean Square F-Ratio P-Value Model 2.56523 1 2.56523 0.12 0.7278 Residual 2973.27 141 21.087 Total (Corr.) 2975.83 142 Correlation Coefficient = -0.0293602 R-squared = 0.0862022 percent R-squared (adjusted for d.f.) = -0.622406 percent Standard Error of Est. = 4.59206 Mean absolute error = 3.64837 Durbin-Watson statistic = 2. 10478 (P=0.7336) Lag 1 residual autocorrelation = -0.0574156 Plot of Fitted Model No. of. Hours commuting = 6.26376 - 0.0208328*No. of. Hours spent studying 24 No. of. Hours commuting 20 TIT TTT TTT C 16 12 9 00 000 C 00 C 9 .A C 00 00 0 0 A 0 0 5 10 15 20 25 30 No. of. Hours spent studyingInterpretation of 'r' value as r= -0.0293 602 which is a negative value but close to zero. It indicates that there is a weaker negative relationship between the number of hours of commuting and hours of studying of the students. hypothesis test Ho: For all the students, there is no linear relationship between their number of commuting hours and number of hours studying Ha: For all the students, there is a linear relationship between their number of commuting hours and number of hours studying. With the sample size of 143, the decision point provided from the correlation coefficient decision point table is 0.176. Because the sample correlation coefficient is bigger than decision point, therefore we have enough evidence to conclude that a linear correlation exists between the number of commuting hours and number of hours studying for students in the population. As the conclusion, we have enough evidence to conclude that the change in number of hours in studying will have a proportional change as there is a change in the number of hours in commuting for the students. The least squares estimated regression equation is Ay = 2.25976 + 0.033107 * x i.e. the estimated number of hours in commuting ofa student = 2.25676 + 0.033107 * number of hours spent in studying of the student. Interpretation of slope: For every one additional hour of commuting time, the estimated number of hours of studying will be decreased by 0.0208328 Interpretation of intercept: There is no physical meaning of the intercept because the number of hours spent studying of a student can't be zero. It is just used for positioning the line
Step by Step Solution
There are 3 Steps involved in it

Get step-by-step solutions from verified subject matter experts