

Question: please dont cut off answer S. NPV profiles An NPV profile plots a project's NPV at various costs of capital, labeled A and B in
please dont cut off answer 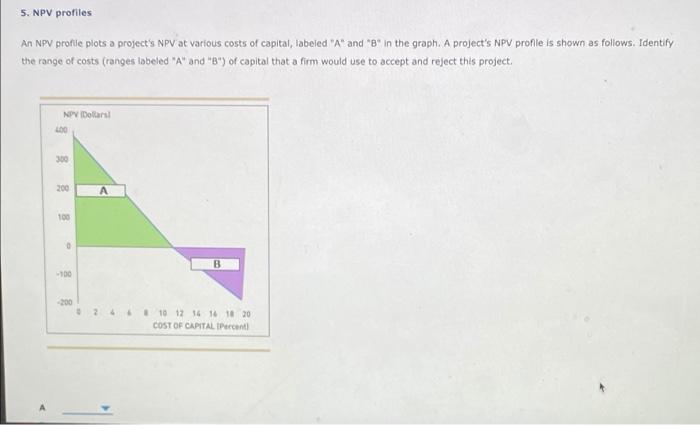
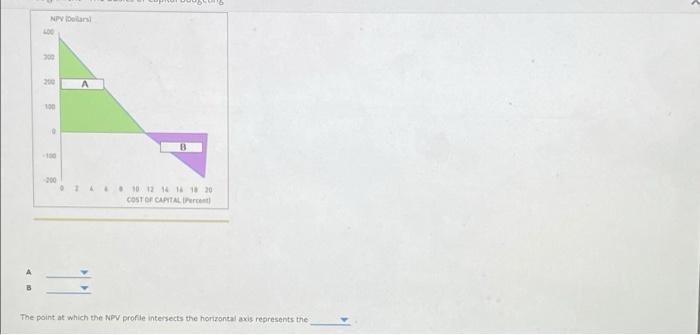
S. NPV profiles An NPV profile plots a project's NPV at various costs of capital, labeled "A" and "B" in the graph. A project's NPV profile is shown as follows. Identify the range of costs (ranges labeled "A" and "B") of capital that a firm would use to accept and reject this project. NPV Dollar 100 B 10 12 14 16 18 20 COST OF CAPITAL I Percent Nani 700 2 A 100 10 12 14 16 18 30 COST OF CAPITALI The point at which the NPV profile intersects the horizontal axis represents the
Step by Step Solution
There are 3 Steps involved in it
1 Expert Approved Answer
Step: 1 Unlock

Question Has Been Solved by an Expert!
Get step-by-step solutions from verified subject matter experts
Step: 2 Unlock
Step: 3 Unlock