

Question: Please compare the listed ratios as explained in the right column. Please do not answer if not completing all ratios. No external sources such as
Please compare the listed ratios as explained in the right column. Please do not answer if not completing all ratios. No external sources such as connecting via email is accepted.
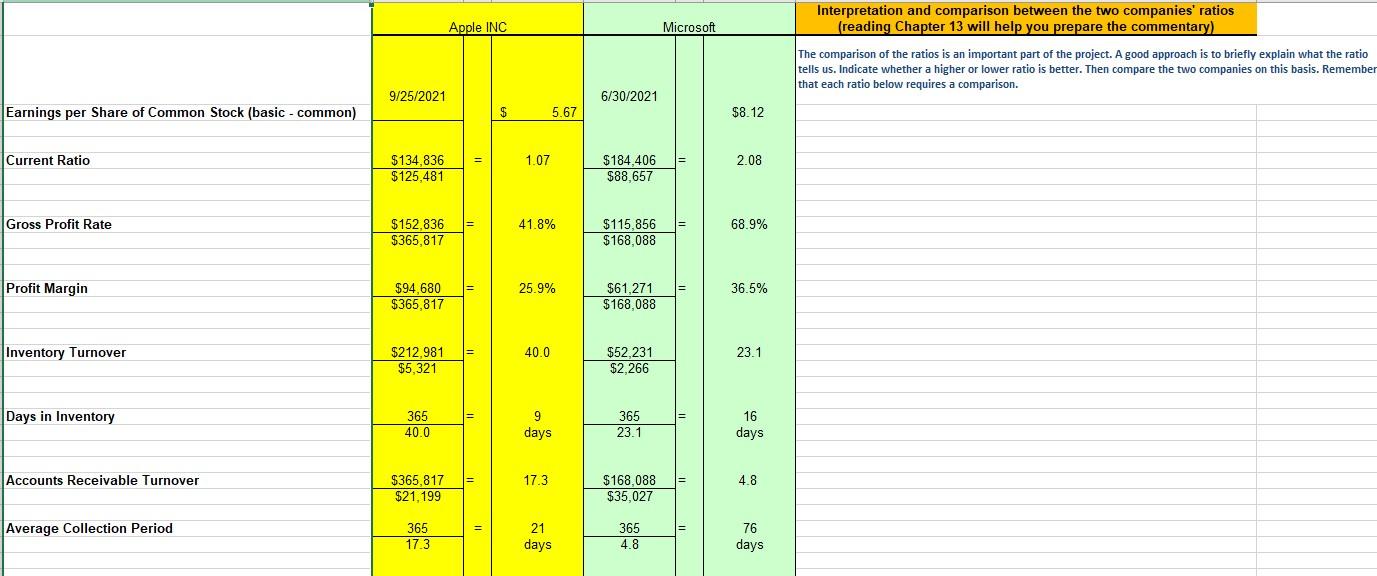
Earnings per Share of Common Stock (basic - common) Current Ratio Gross Profit Rate Profit Margin Inventory Turnover Days in Inventory Accounts Receivable Turnover Average Collection Period 9/25/2021 $134,836 $125,481 $152,836 = $365,817 $94,680 = $365,817 $212,981 $5,321 365 40.0 Apple INC $365,817 $21,199 365 17.3 = = = $ 1.07 41.8% 5.67 25.9% 40.0 9 days. 17.3 21 days 6/30/2021 $184,406 $88,657 $115,856 $168,088 $61,271 $168,088 $52,231 $2,266 365 23.1 $168,088 $35,027 365 4.8 Microsoft $8.12 2.08 68.9% 36.5% 23.1 16 days 4.8 76 days Interpretation and comparison between the two companies' ratios (reading Chapter 13 will help you prepare the commentary) The comparison of the ratios is an important part of the project. A good approach is to briefly explain what the ratio tells us. Indicate whether a higher or lower ratio is better. Then compare the two companies on this basis. Remember that each ratio below requires a comparison
Step by Step Solution
There are 3 Steps involved in it

Get step-by-step solutions from verified subject matter experts