

Question: Please Complete C and E (data is attached) 1/T(K) Calc. k' Ink E. Determination of Activation Energy Time for color change Reaction rate 1. Trial
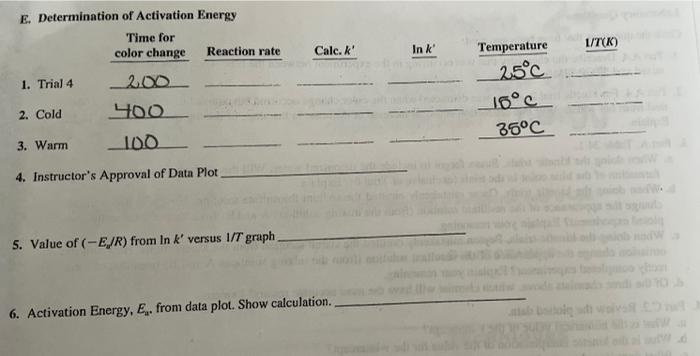
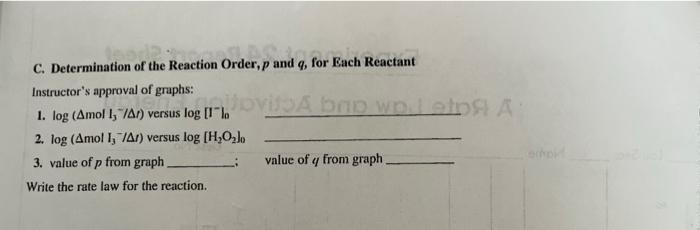
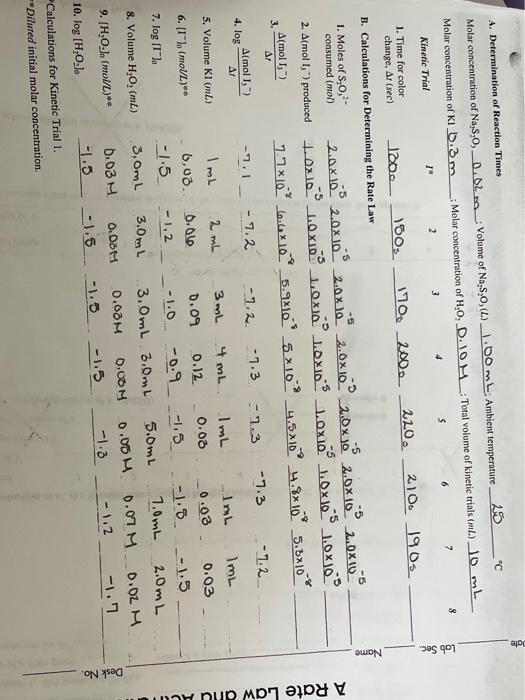
1/T(K) Calc. k' Ink E. Determination of Activation Energy Time for color change Reaction rate 1. Trial 4 _2.00 2. Cold 400 Temperature 25C 16c 35C 3. Warm 100 4. Instructor's Approval of Data Plot 5. Value of (-E/R) from In k' versus 1/T graph 6. Activation Energy, E. from data plot. Show calculation. ole C. Determination of the Reaction Order, p and q, for Each Reactant Instructor's approval of graphs: 1. log (Amol 1, 7A) versus log [1"lo 2. log (Amol 1,-/AI) versus log [H2O2). 3. value of p from graph value of 4 from graph 4 Write the rate law for the reaction. log (1) Order,p and g, f A bro wples A A. Determination of Reaction Times Molar concentration of Na,s,o, 0.02 m_Volume of Na, S., (L) 1.00 mL Ambient temperature 25 " Molar concentration of kl 0.3 m - Molar concentration of H.O, D.OM: Total volume of kinetic trials (m) 10mL 8 7 3 6 3 2 1 Lab Sec. Kinetic Trial 220. 2100 1905 1. Time for color change, A1 (sec) 120. 150. 170 2000 B. Calculations for Determining the Rate Law - -5 -5 -5 -5 1. Moles of S.0,- consumed (mol) 2.ax 102.0x10.5 2.0x10 2.0x10.9 2.0 x JS 2.0x10 2.0x1. 2. Almol 1,1) produced t.ox10 1.0 x10³ 10x10 10x10 10x Oxlos 1.0x10 A(mol T, 7.7x10.6.43.10 5.9x10⁹ 5x104.5x10 4.8x10⁹ 5.8*10* 3. -7.3 -7.3 -7.2 -2.3 - 7.2 -1.2. A Rate Law aflu -1.1 Almol 1) Ar 4. log 3mL 5. Volume K1 () 0.09 4mL. 0.12 -0.9 6. [1"). (mol)** -1.0 7. log II"). ImL 2 mL 6.03. 0.00 -1.5 -1.2 3,0mL 3.0mL . 03 O. DOM -1.5 -1.5 ImL ImL Im 0.08 0.03 0.03 -1.5 -1.8 -1.5 5.0mL 7.0mL 2.0mL 0.00 0.01 M 0.02 M -1.3 - 1.2 -1.7 8. Volume H,O, (ML) 3.0mL 3.0mL 0.00M 0.00M -1.5 -1.5 9. [H.O.). (mol/L)** Desk No. 10. log [H,0.J. Calculations for Kinetic Trial 1. Diluted initial molar concentration. 1/T(K) Calc. k' Ink E. Determination of Activation Energy Time for color change Reaction rate 1. Trial 4 _2.00 2. Cold 400 Temperature 25C 16c 35C 3. Warm 100 4. Instructor's Approval of Data Plot 5. Value of (-E/R) from In k' versus 1/T graph 6. Activation Energy, E. from data plot. Show calculation. ole C. Determination of the Reaction Order, p and q, for Each Reactant Instructor's approval of graphs: 1. log (Amol 1, 7A) versus log [1"lo 2. log (Amol 1,-/AI) versus log [H2O2). 3. value of p from graph value of 4 from graph 4 Write the rate law for the reaction. log (1) Order,p and g, f A bro wples A A. Determination of Reaction Times Molar concentration of Na,s,o, 0.02 m_Volume of Na, S., (L) 1.00 mL Ambient temperature 25 " Molar concentration of kl 0.3 m - Molar concentration of H.O, D.OM: Total volume of kinetic trials (m) 10mL 8 7 3 6 3 2 1 Lab Sec. Kinetic Trial 220. 2100 1905 1. Time for color change, A1 (sec) 120. 150. 170 2000 B. Calculations for Determining the Rate Law - -5 -5 -5 -5 1. Moles of S.0,- consumed (mol) 2.ax 102.0x10.5 2.0x10 2.0x10.9 2.0 x JS 2.0x10 2.0x1. 2. Almol 1,1) produced t.ox10 1.0 x10³ 10x10 10x10 10x Oxlos 1.0x10 A(mol T, 7.7x10.6.43.10 5.9x10⁹ 5x104.5x10 4.8x10⁹ 5.8*10* 3. -7.3 -7.3 -7.2 -2.3 - 7.2 -1.2. A Rate Law aflu -1.1 Almol 1) Ar 4. log 3mL 5. Volume K1 () 0.09 4mL. 0.12 -0.9 6. [1"). (mol)** -1.0 7. log II"). ImL 2 mL 6.03. 0.00 -1.5 -1.2 3,0mL 3.0mL . 03 O. DOM -1.5 -1.5 ImL ImL Im 0.08 0.03 0.03 -1.5 -1.8 -1.5 5.0mL 7.0mL 2.0mL 0.00 0.01 M 0.02 M -1.3 - 1.2 -1.7 8. Volume H,O, (ML) 3.0mL 3.0mL 0.00M 0.00M -1.5 -1.5 9. [H.O.). (mol/L)** Desk No. 10. log [H,0.J. Calculations for Kinetic Trial 1. Diluted initial molar concentration
Step by Step Solution
There are 3 Steps involved in it

Get step-by-step solutions from verified subject matter experts