

Question: Please complete the table below. Create a graph of the forecasted demand using a paper and post your results below. SHOW YOUR SOLUTION SIMPLE EXPONENTIAL
Please complete the table below. Create a graph of the forecasted demand using a paper and post your results below. SHOW YOUR SOLUTION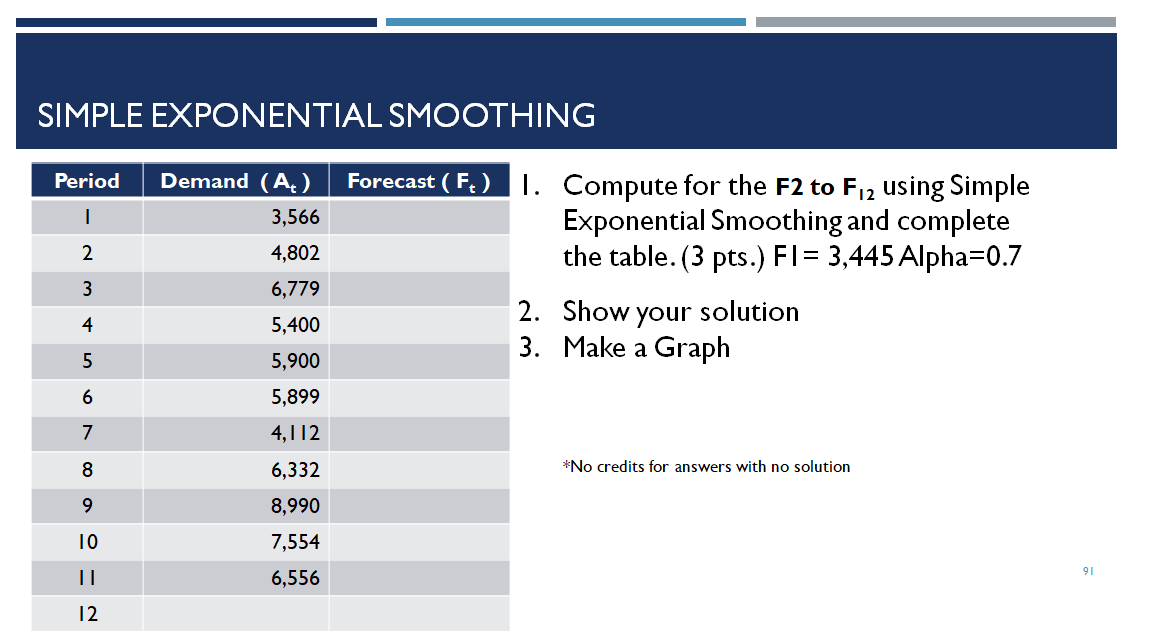
Step by Step Solution
There are 3 Steps involved in it
1 Expert Approved Answer
Step: 1 Unlock

Question Has Been Solved by an Expert!
Get step-by-step solutions from verified subject matter experts
Step: 2 Unlock
Step: 3 Unlock