

Question: Please complete the table below. Create a graph of the forecasted demand using a paper and post your results below. NAIVE APPROACH Period Demand (A)
Please complete the table below. Create a graph of the forecasted demand using a paper and post your results below.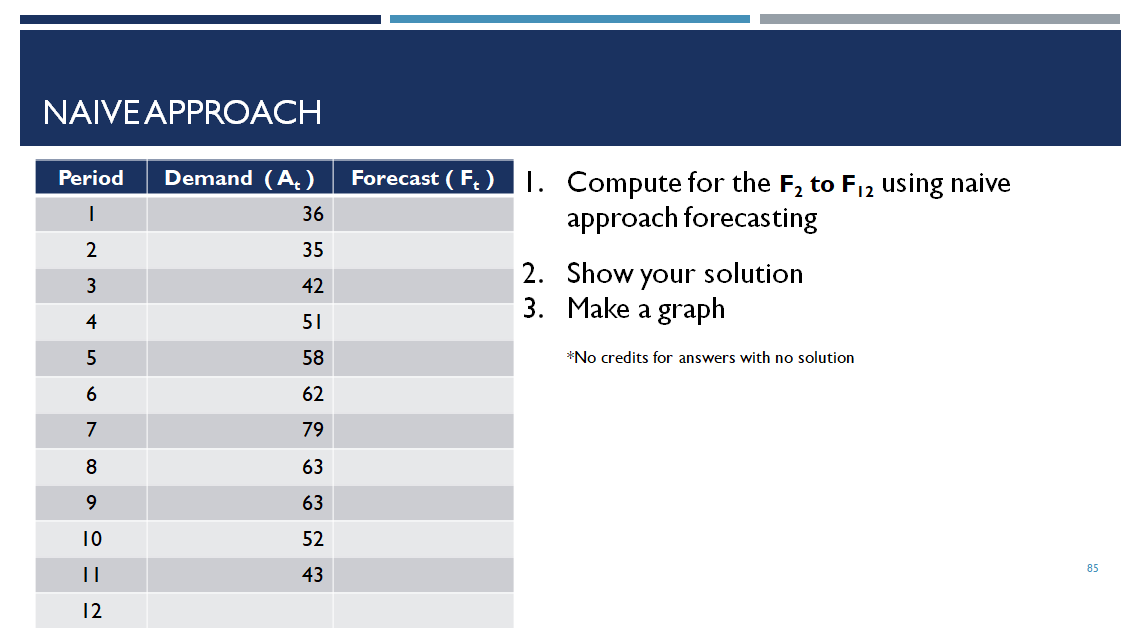
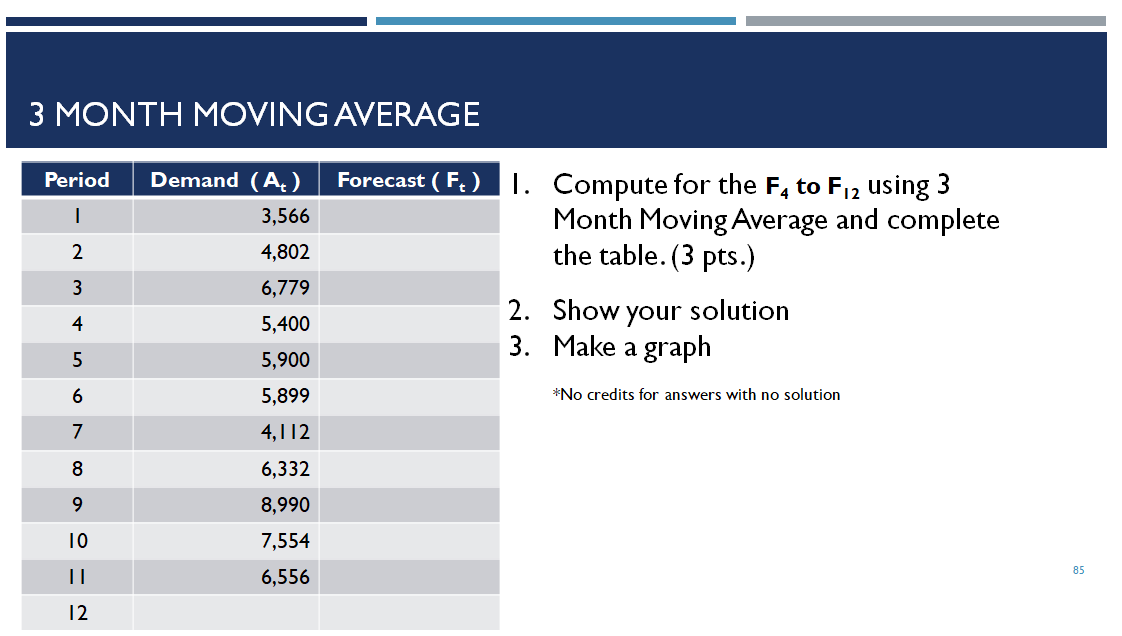
NAIVE APPROACH Period Demand (A) Forecast (F) 1. Compute for the F, to F12 using naive approach forecasting 1 36 2 35 3 42 2. Show your solution 3. Make a graph 4 51 5 58 *No credits for answers with no solution 6 62 7 79 8 63 9 63 10 52 85 11 43 12 3 MONTH MOVING AVERAGE Period Forecast (F) | 2 Demand (A) 3,566 4,802 6,779 5,400 5,900 5,899 1. Compute for the F4 to F12 using 3 Month Moving Average and complete the table.(3 pts.) 2. Show your solution 3. Make a graph 3 4 5 6 *No credits for answers with no solution 7 4,112 6,332 8 9 8,990 10 7,554 85 6,556 12
Step by Step Solution
There are 3 Steps involved in it
1 Expert Approved Answer
Step: 1 Unlock

Question Has Been Solved by an Expert!
Get step-by-step solutions from verified subject matter experts
Step: 2 Unlock
Step: 3 Unlock